
Figure 5: Neurons form less cellular aggregates on more conductive scaffolds and neurites span the scaffold architecture.
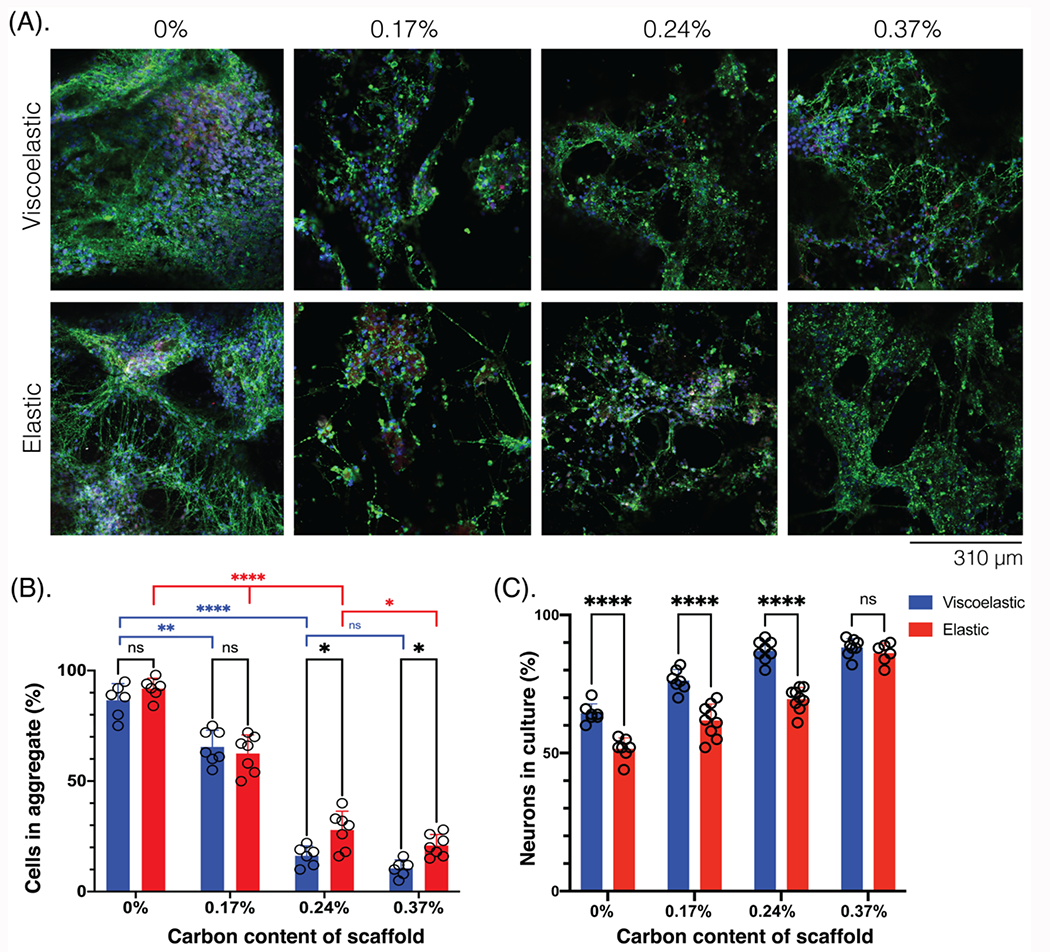
(A) Photomicrographs of NPCs in the scaffolds of different mechanical properties (viscoelastic, elastic) and scaffold carbon content (%), compared after 6 weeks in culture and stained for neuronal markers. Tuj1 (green), NeuN (white), NPC (red), Hoescht (blue). Scale bar: 310 μm. (B) Quantification of the number of cells that have aggregated together (aggregate diameter > 100 μm) across scaffold carbon content (%) and mechanical properties (viscoelastic: blue; elastic: red). At least 5 field of views compared for each condition. (C) Quantification of the neurons (Tuj1+) in culture (%), across scaffold carbon content (%) and mechanical properties (viscoelastic: blue; elastic: red). At least 7 fields of view compared for each condition. All numerical data are presented as mean ± s.d. (one-way analysis of variance (ANOVA) and Tukey’s honestly significant difference (HSD) post hoc test: ****P < 0.0001, 0.001<**-<0.01, 0.01 < *P < 0.05, non-significant (n.s.) P > 0.05).