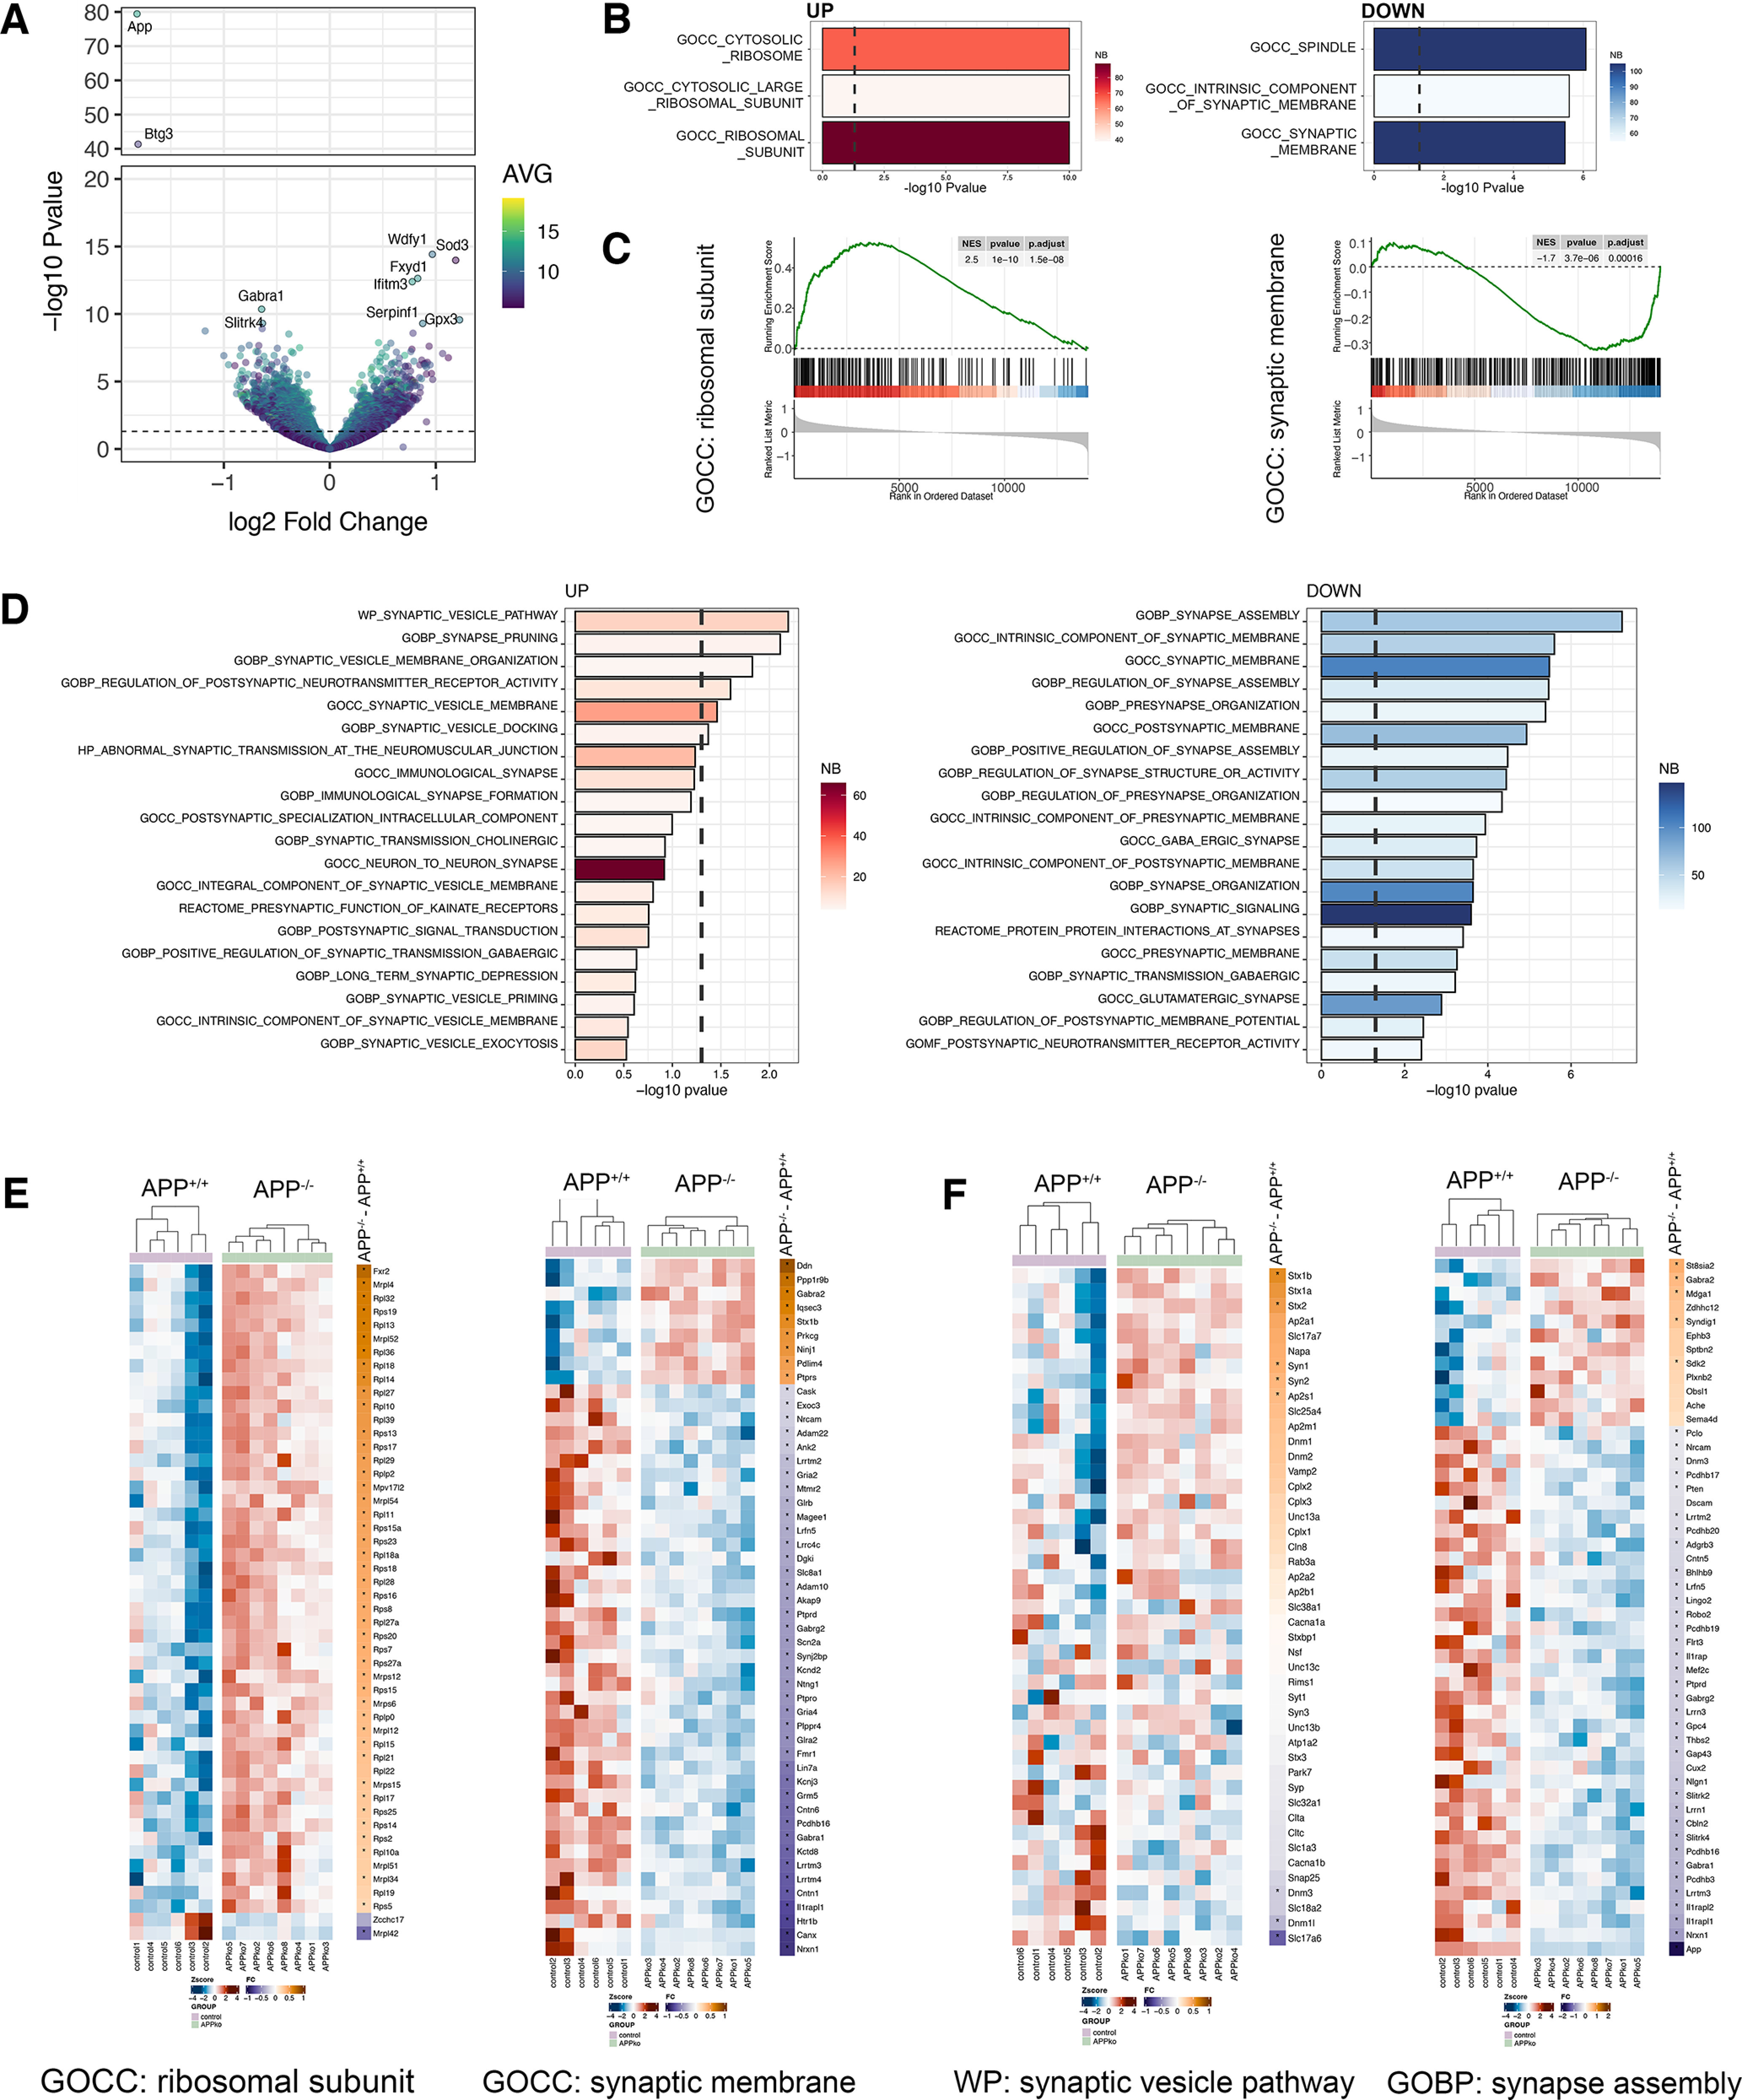
Figure 4.

APP deficiency modulates the dentate gyrus transcriptome. A, Volcano plot showing regulated genes between APP-deficient (APP−/−) versus wild type (APP+/+; nAPP+/+= 6 tissue cultures, nAPP−/− = 8 tissue cultures; Extended Data Table 4-1 shows complete differential gene expression analysis). Dashed line indicates the significance threshold [−log10(0.05)]. Right, Color code represents the average (AVG) expression level across all samples. Top ten regulated genes are labeled. B, Top three GOCC regulated terms in APP-deficient versus wild type. Right, Color codes represent the number (NB) of genes within the gene sets. C, Enrichment plot of ribosomal subunit (left) and synaptic membrane (right). Black dashes indicate the ranked list of genes that belong to the respective gene set. D, Top twenty upregulated and downregulated terms related to the synapse across the whole MSigDB. Right, Color code represents the number (NB) of genes within the gene sets. E, F, Gene level heat maps of selected gene sets from unbiased (E, compare B, C) and synapse-focused analysis (F, compare D) showing the row-wise scaled expression (Z-score, left) and the log2 fold change between APP-deficient and wild-type cultures (right). The asterisks indicate significant regulation. Genes are ranked according to the log2 fold change from high to low.
