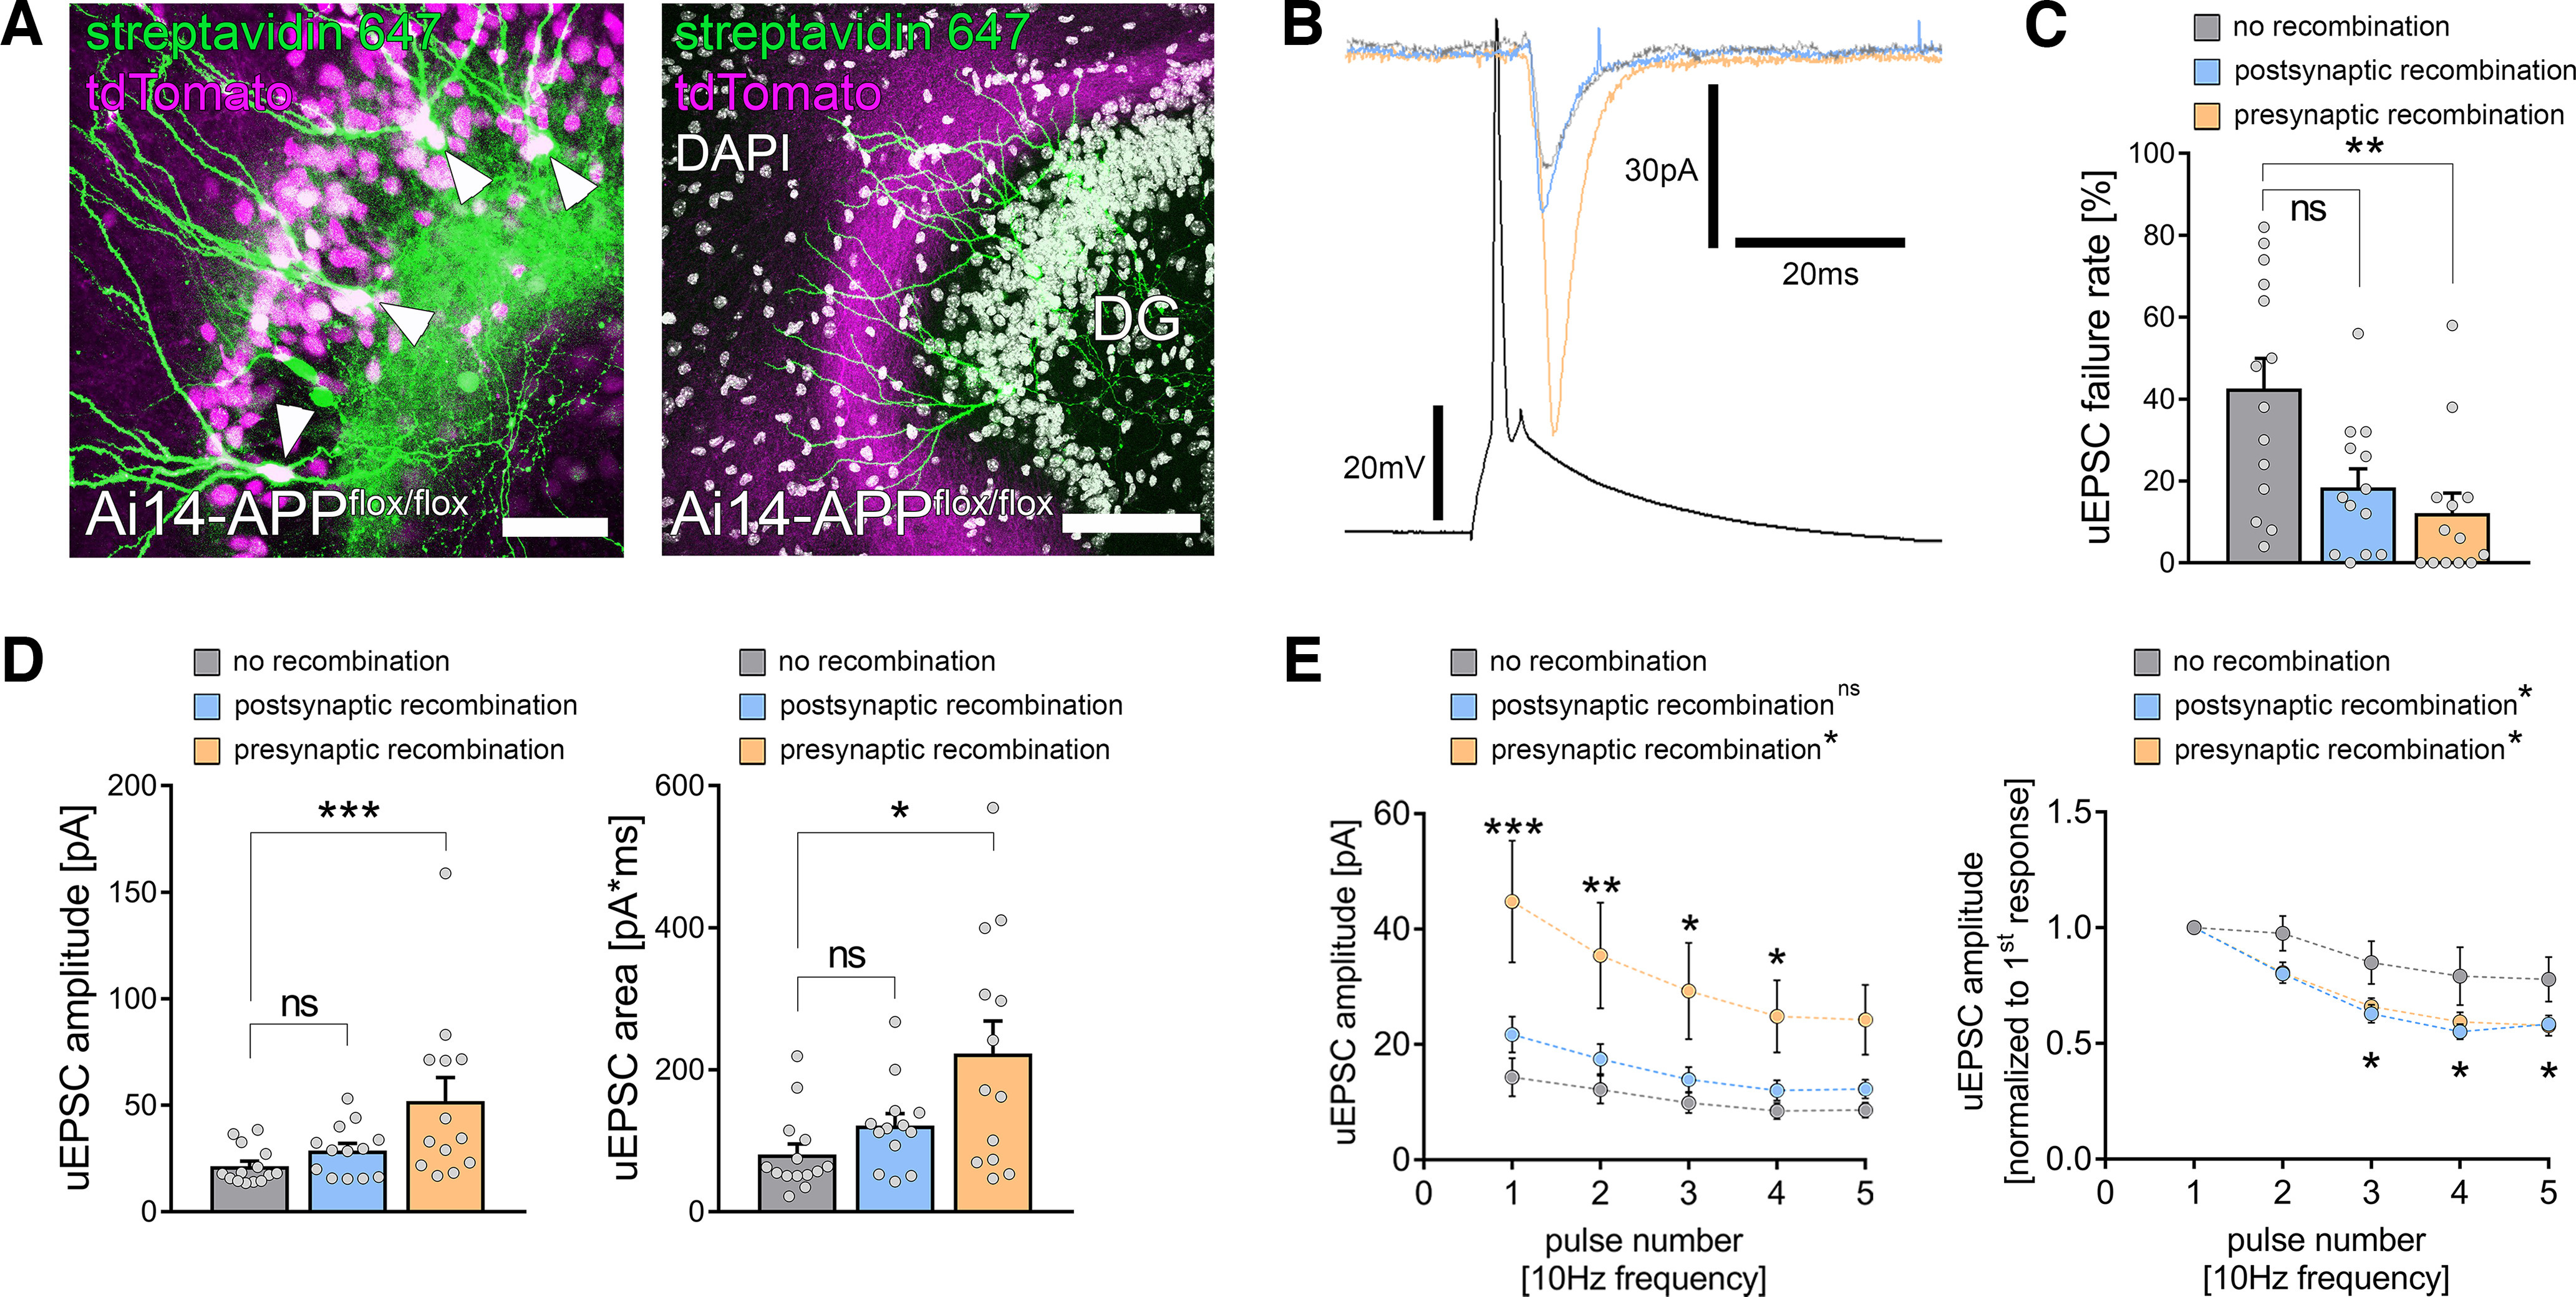
Figure 6.

Presynaptic APP restrains excitatory neurotransmission at medial perforant path synapses. A, To achieve compartment-specific deletion of APP, tissue cultures from Ai14-APPflox/flox animals were prepared, and region-specific recombination was achieved by a local injection of a Cre-expressing virus in either the dentate gyrus (left) or the medial part of the entorhinal cortex (right). Granule cells (arrowheads, post hoc staining with streptavidin 647 of cells that were filled with biocytin during the recording) were patched, and recombination was evaluated during the patch-clamp experiment by the tdTomato signal. Scale bars, (left) 50 µm; (right) 100 µm. B, Electrophysiological properties were assessed in monosynaptic connected pairs of neurons with no recombination (gray trace) or postsynaptic (blue trace) or presynaptic (orange trace) recombination. C, The uEPSC failure rate was significantly decreased in connected pairs with presynaptic APP deficiency, whereas postsynaptic APP deficiency resulted in a nonsignificant trend toward increased synaptic reliability (nno recombination = 14 pairs in 5 tissue cultures; npostsynaptic recombination = 13 pairs in 5 tissue cultures; npresynaptic recombination = 13 pairs in 5 tissue cultures; Kruskal–Wallis test followed by Dunn's multiple comparisons test). D, Presynaptic but not postsynaptic recombination was accompanied by an increase in both uEPSC amplitude and area when compared with nonrecombined pairs of neurons (Kruskal–Wallis test followed by Dunn's multiple comparisons test). E, Assessment of short-term plasticity confirmed the increase in uEPSC amplitude on presynaptic but not postsynaptic recombination. Moreover, normalized analysis revealed a more prominent synaptic depletion after both presynaptic and postsynaptic recombination (RM 2-way ANOVA with Sidak's multiple comparisons test; statistical analysis provided in Extended Data Table 6-1, Table 6-2). Individual data points are indicated by gray dots. Values represent mean ± SEM (*p < 0.05, **p < 0.01, ***p < 0.001; ns, not significant).
