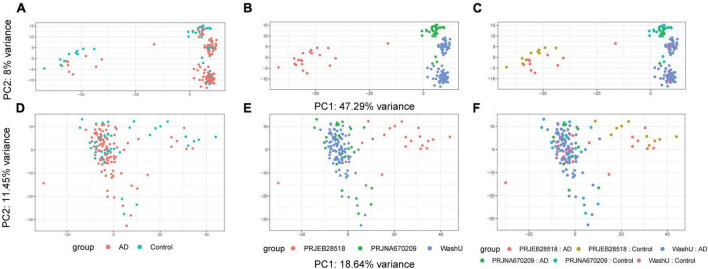
FIGURE 1.
Results of batch effect correction on data structure shown via PCA. Before and after batch correction. Prior to batch correction using ComBat-Seq, much of the variance could be attributed to the provenance of the data sets. (A) PCA plot before batch effect correction colored by group. (B) PCA plot before batch effect correction colored by source. (C) PCA plot before batch effect correction colored by group and source. (D) PCA plot after batch effect correction colored by group. (E) PCA plot after batch effect correction colored by source. (F) PCA plot before batch effect correction colored by group and source.

