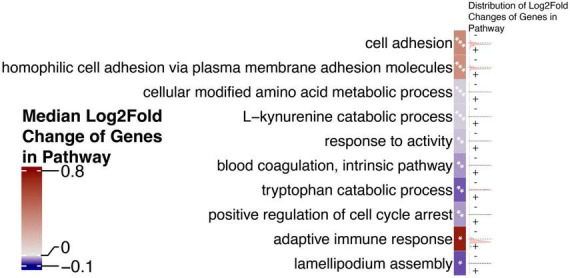
FIGURE 4.

Gene set enrichment analysis of genes proximal to differentially expressed HERVs reveals dysregulated pathways that may be at play in AD. The top 10 most significant pathways, ranked by p-value are shown. Cells which contain one asterisk (*) represent pathways with p-values less than 0.05 but greater than 0.005. Cells which contain two asterisks (**) represent pathways with p-values less than 0.005 but greater than 0.001. Cells which contain three asterisks (***) represent pathways with p-values less than 0.001. Cells are annotated on the right with density plots showing the distribution of the log2 fold changes of genes in a given pathway. Cells are colored by the median log2 fold change of genes in the pathway to indicate the general directionality of the pathway in AD.
