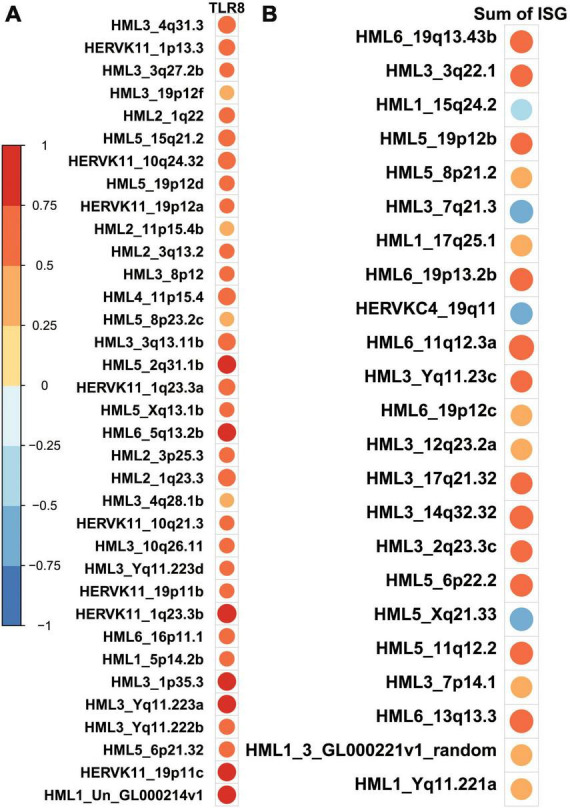
FIGURE 5.

HERV-K loci which are significantly correlated with gene expression of interest tend to show positive correlations. Cells show circles whose size and color are indicative of the Pearson correlation coefficient associated with a correlation test between the transcript counts of the transcripts and HERV-K loci. Larger, redder circles indicate correlation coefficients that approach 1. Larger, bluer circles indicate correlation coefficients that approach –1. Only significant associations are shown in order to save space; a full depiction of the correlation between all HERV-K loci and TLR8 is given in the Supplementary material. (A) HERV-K loci which are significantly correlated with TLR8 expression all show a positive direction of such a correlation. (B) HERV-K loci which are significantly correlated with a sum of the expression of interferon-stimulated genes (ISG) mostly show a positive direction of such a correlation–19/23 correlation values are positive.
