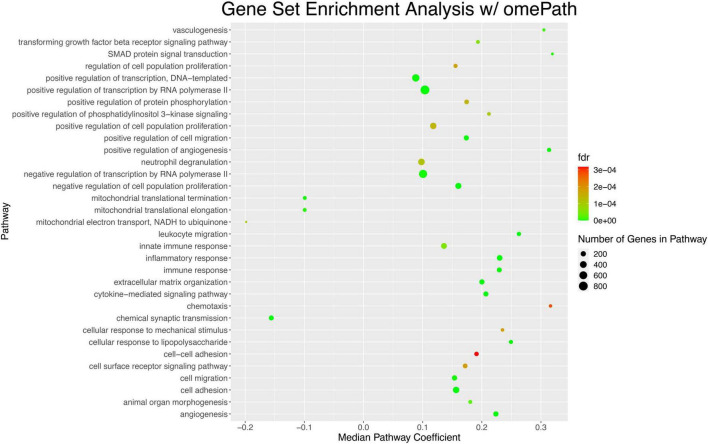
FIGURE 8.
Gene set enrichment analysis of DE genes in AD highlights pathways that are significantly dysregulated in the parietal lobe. The top 33 pathways sorted by lowest p-value are shown. Each dot represents a pathway; the position of the dot on the x-axis represents the coefficient of the median gene in that pathway. The color of the gene, on a color scale from red to green, represents an increasingly more significant p-value associated with the dysregulation of the pathway. The size of the dot indicates the number of genes in the pathway; in this case pathways ranged from ∼200 genes to ∼800 genes.

