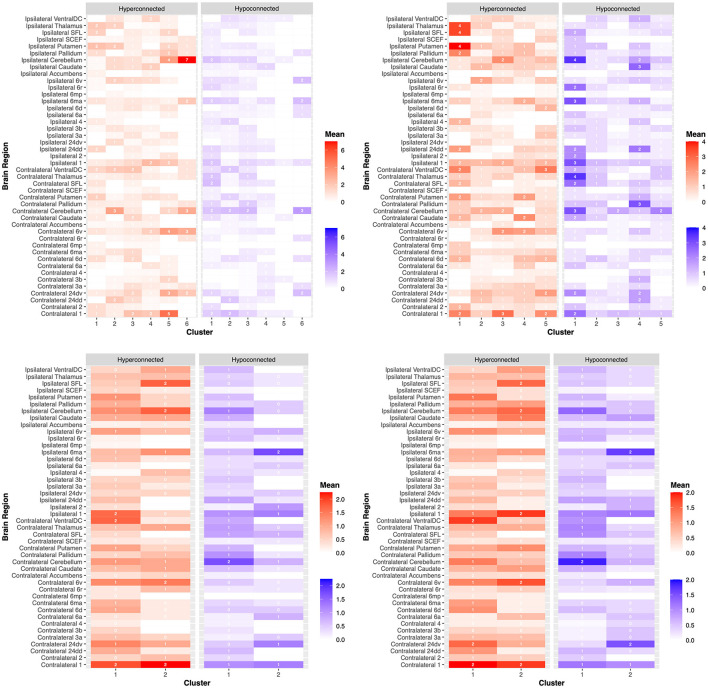
Figure 4.
Dysfunctional connectivity between patient clusters. Connectivity anomalies are demonstrated on a heat map between patients according to clustering analyses for the (1) National Institutes of Health Stroke Scale (NIHSS) (top left), (2) Barthel Index (BI) (top right), (3) Fugl-Meyer Assessment (FMA) (bottom left), and (4) Wolf Motor Function Test (WMFT) (bottom right). Hyperconnected parcels are demonstrated in red, with a higher mean number of hyperconnections in dark red and a lower mean number of hyperconnections in light red. Hypoconnected parcels are demonstrated in blue, with a higher mean number of hypoconnections in dark blue and a lower mean number of hypoconnections in light blue. Each brain region, ipsilateral or contralateral to the stroke site, is labeled on the y-axis. Individual patient clusters are on the x-axis. These outcomes are further demonstrated in the Supplementary material.

