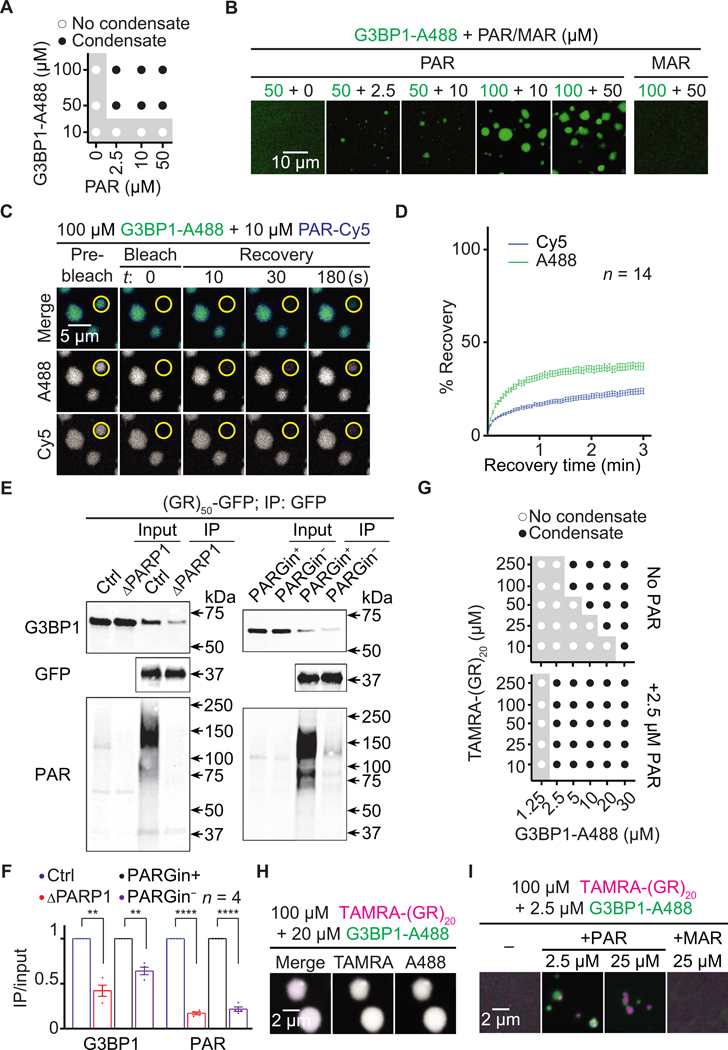
Fig. 5. PAR promotes G3BP1 condensation and interaction with poly(GR).
(A) Phase diagram and (B) images of Alexa 488–labeled recombinant G3BP1 (G3BP1-A488; green) mixed with PAR (2.5 to 50 μM MAR equivalents) or 50 μM MAR. (C and D) FRAP assays on G3BP1-A488 (green) and PARCy5 (blue) condensates. Yellow circles indicate bleached and analyzed areas. (E) Co-IP of (GR)50-GFP and endogenous G3BP1 in control (Ctrl) or PARP1 KO (ΔPARP1) HEK293T cells or in Ctrl HEK293T cells with or without the PARG inhibitor PDD00017273 (PARGin+ or PARGin−, respectively) in the lysis and IP buffer. Quantified in (F). Student’s t tests. **P < 0.01; ****P < 0.0001. Means ± SEM. (G) Phase diagram and (H and I) images of TAMRA-(GR)20 (magenta) mixed with G3BP1-A488 (green) and PAR (2.5 to 25 μM MAR equivalents) or 25 μM MAR. Total molecules (1 μM) were fluorescently labeled. Buffer for condensation assays: PBS.

