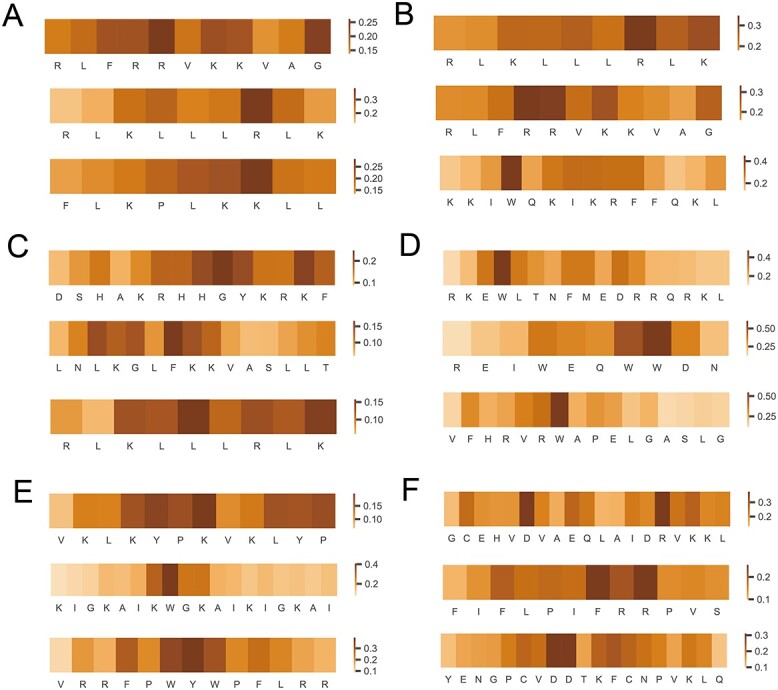
Figure 7.

Model interpretability analysis using SHAP values for selected AMPs. (A) Anti-Gram negative, (B) anti-Gram positive, (C) antifungal, (D) antiviral, (E) anti-mammalian cells and (F) anticancer. The value on the color scale of each panel indicates the relative importance. The higher the value, the more important the corresponding amino acid residue for the functional activity of AMPs.
