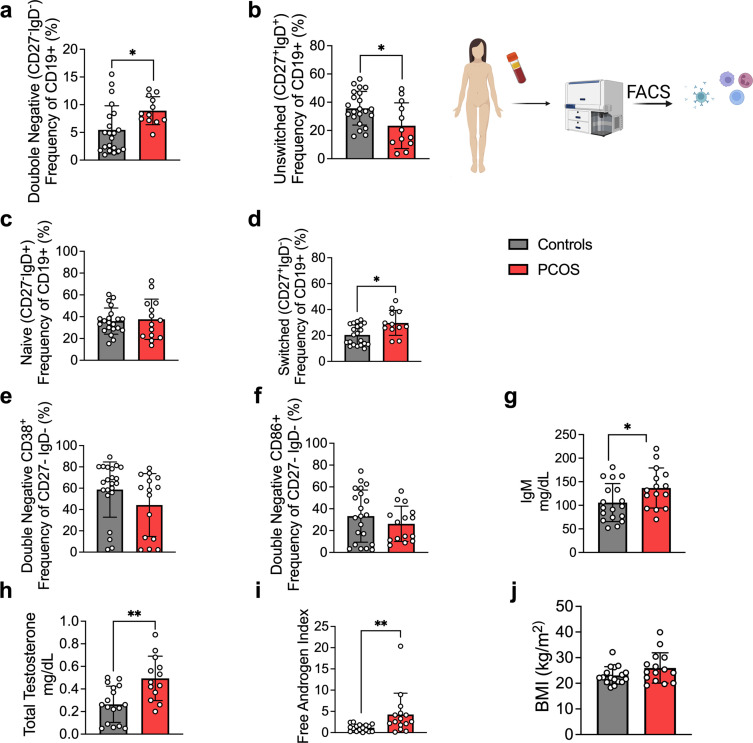
Figure 1. B cell frequencies and immunoglobulin M (IgM) variations in women with polycystic ovary syndrome (PCOS).
(a) Total CD19+ double-negative (DN) B cells (CD27- IgD-). (b) Total unswitched B cells (CD27+IgD+ ). (c) Total naive B cells (CD27- IgD+). (d) Total switched B cells (CD27+IgD-). (a–d) Total CD19+ populations (controls n = 22; PCOS n = 15). (e, f) Expression on double-negativeDN B cells respectively of the surface markers CD38 and CD86. (g) Circulating IgM titers. (h) Total testosterone. (i) Free androgen index (FAI). (j) Body mass index (BMI). (g–j) Controls n = 18; PCOS n = 15. All bars indicate means, error bars SD, circles represent human individuals. In the case of missing values due to lack of measurement, individuals were excluded from the analysis report for that variable. Unpaired Student’s t-test for analysis of naive, unswitched, and DN CD86+ B cells, total testosterone, and BMI. Mann–Whitney test for all other B cell frequencies, antibody titers, and FAI. *p<0.05, **p<0.01, ***p<0.001.


