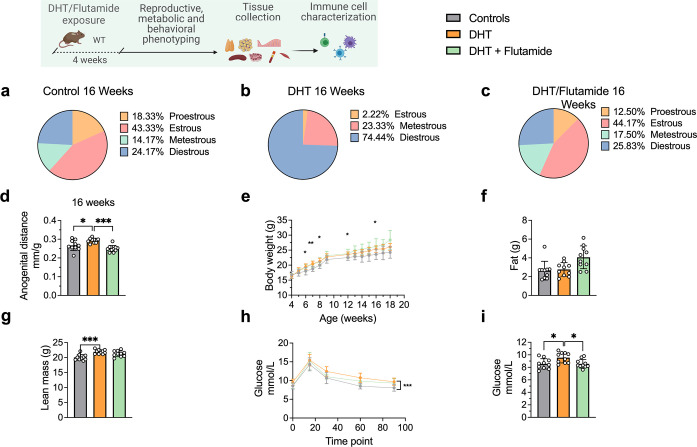
Figure 4. Dihydrotestosterone (DHT)-induced polycystic ovary syndrome (PCOS)-like mouse model phenotypic study at 16 weeks of age.
(a) Estrous cycles in WT control mice. (b) Estrous cycles in mice receiving DHT pellet implant. (c) Estrous cycles in mice receiving DHT pellet and flutamide implant. (d) Anogenital distance normalized to body weight (BW). (e) Weekly BW. (f) EchoMRI record of fat body composition. (g) EchoMRI record of lean body composition. (h) Oral glucose tolerance test (OgTT). (i) Fasting glucose. (a–i) WT control mice (n = 10), mice receiving DHT pellet implant (n = 10), mice receiving DHT pellet and flutamide implant (n = 10). All bars indicate means, circles represent individual mice. In the case of missing values due to lack of measurement, mice were excluded from the analysis report for that variable. Unpaired Student’s t-test for analysis of anogenital distance difference between groups, as well as EchoMRI results and fasting glucose; two-way ANOVA with Sidak’s post hoc test for analysis of weekly BW recordings and blood glucose throughout the study. *p<0.05, **p<0.01, ***p<0.001.

