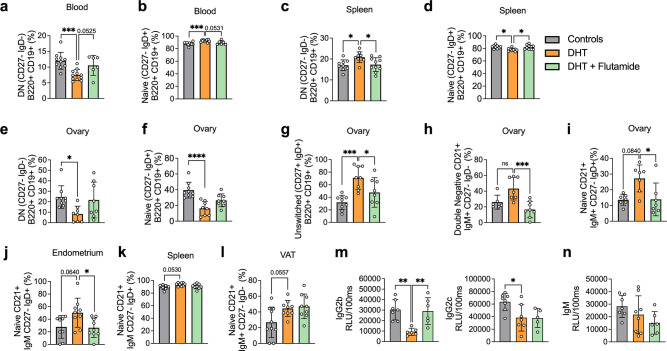
Figure 5. Dihydrotestosterone (DHT)-induced polycystic ovary syndrome (PCOS)-like mouse model B cell frequencies.
(a) Blood double-negative (DN) B cells in 13-week-old mice. (b) Blood naive B cells in 13-week-old mice. (a, b) 13-week-old WT control mice (n = 10), mice receiving DHT pellet implant (n = 11), and mice receiving DHT pellet and flutamide implant (n = 10). (c) Spleen DN B cells in 20-week-old mice. (d) Spleen naive B cells in 20-week-old mice. (e) Ovary DN B cells in 20-week-old mice. (f) Ovary naive B cells in 20-week-old mice. (g) Ovary unswitched B cells in 20-week-old mice. (h) Ovary DN CD21+ B cells in 20-week-old mice. (i) Ovary naive CD21+ B cells in 20-week-old mice. (j) Visceral adipose tissue (VAT) naive CD21+ B cells in 20-week-old mice. (k) Spleen naive CD21+ B cells in 16-week-old mice. (l) Endometrium naive CD21+ B cells in 20-week-old mice. (m) Circulating IgG titers in 20-week-old mice. (n) Circulating IgM titers in 20-week-old mice. (c–n) 16–20-week-old WT control mice (n = 10), mice receiving DHT pellet implant (n = 9), and mice receiving DHT pellet and flutamide implant (n = 10). All bars indicate means, circles represent individual mice. In the case of missing values due to lack of measurement, mice were excluded from the analysis report for that variable. One-way ANOVA for multiple-comparisons of normally distributed data, Kruskal–Wallis test for data that is not normally distributed. *p<0.05, **p<0.01, ***p<0.001.


