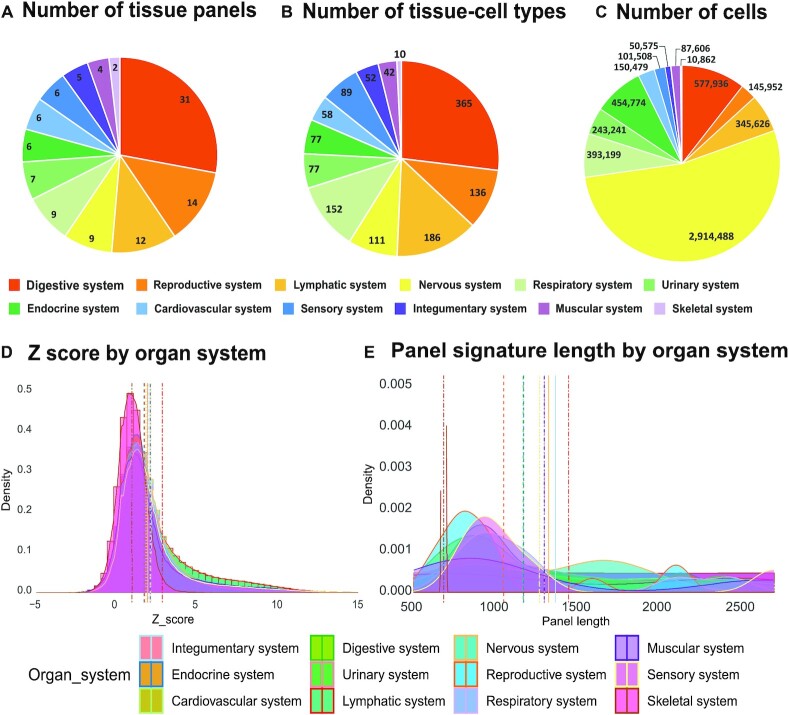
Figure 2.
Summary for data curation for constructing our tissue-cell type signature panel and permutation test. In the pie charts A, B and C, each color represents one human organ system; (A) shows the number of tissues collected in each organ system. (B) shows the number of tissue-cell types collected in each organ system. (C) shows the total number of cells collected in each organ system. In the density plot of D&E, each color represents one human organ system, and the vertical line in the corresponding color represents the mean of Z score of each organ system. (D) For each organ, we plot the density distribution and mean of the permutation z scores pre-calculated by deTS algorithm using the ∼20 000 genetic trait-associated gene sets (TAGs) and single-cell signature panels. (E) For each organ, we plot the density distribution and mean of panel signature length by organ system.

