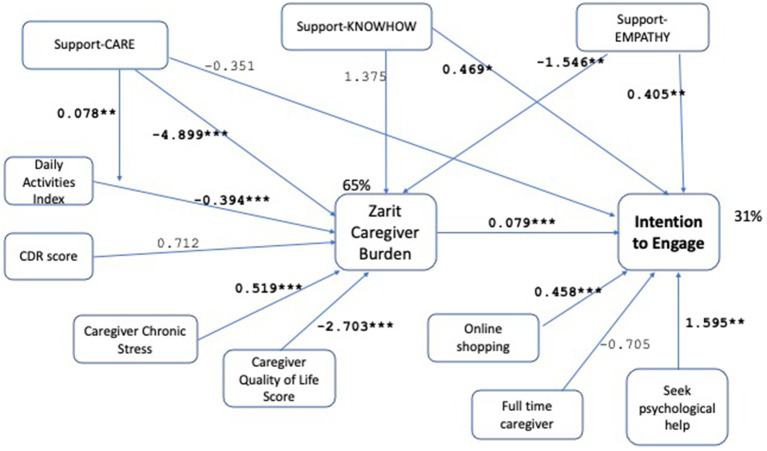
Figure 2.
Path model analysis results with unstandardized path coefficients. The model demonstrates good fit with χ2 (p-value = 0.941 > 0.05), RMSEA (RMSEA ≤0.05 p-value = 0.983), CFI (1.0 > 0.9), SRMR (0.006 < 0.08) measures. The significant associations are shown bold with the coefficients shown on the links, and the significance levels indicated as (*p < 0.1, **p < 0.05, ***p < 0.001). The R-square values are 65% for caregiver burden, 31% for the intention to engage. The conceptual model shown in Figure 1 is operationalized with the variables in the model above. Thus, for each concept there is more than one measure used; for example, existing household support is measured by support-CARE, support-KNOWHOW, support-EMPATHY. The model supports all tested hypotheses. While some of the measures for each concept remain insignificant, there is at least one measure for each concept that shows a significant association supporting the stated hypothesis.

