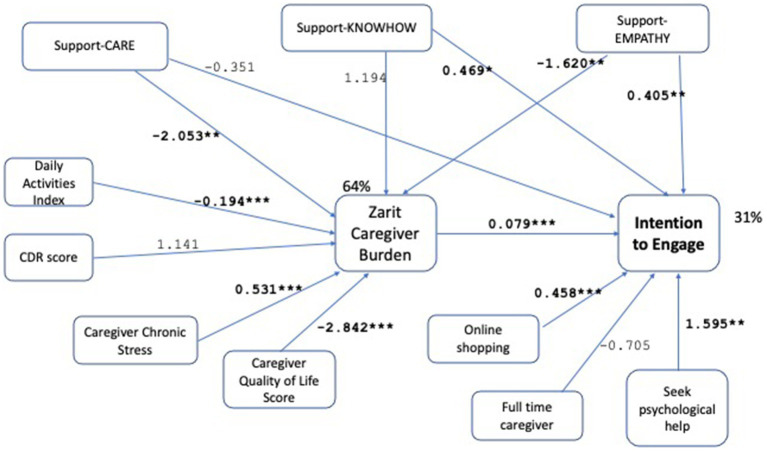
Figure 3.
Path model without moderation effect, results with unstandardized path coefficients. Demographic controls are omitted from the figure for clarity of presentation. *p < 0.1, **p < 0.05, ***p < 0.001. This model is a robustness check for the model given in Figure 2, where the only modification is the removal of the moderation of daily activities by support-CARE. The model again demonstrates good fit with χ2 (p-value = 0.925 > 0.05), RMSEA (RMSEA ≤0.05 p-value = 0.983), CFI (1.0 > 0.9), SRMR (0.006 < 0.08) measures. R-square for caregiver burden and intention to engage are found as 64% and 31%, respectively. All hypotheses are supported by significant associations with at least one measure, supporting robustness of the results of the original model (given in Figure 2).

