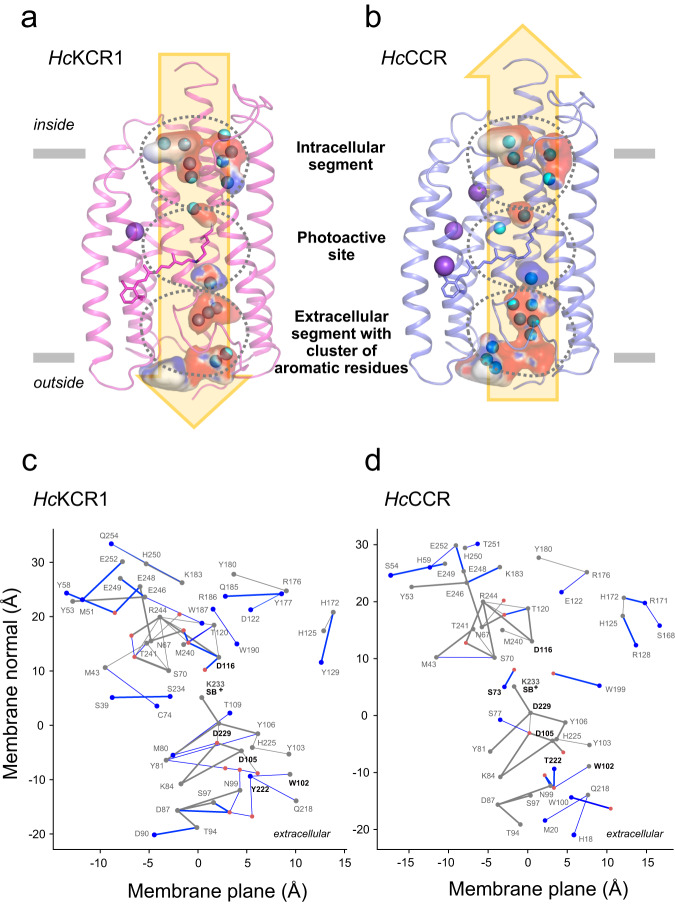
Fig. 3. Comparison of cavities, cation conduction pathway, and H-bonding networks.
Comparison of the internal cavities of HcKCR1 (a) and HcCCR1 (b) and their electrostatic potential. Cavities were modelled with HOLLOW50 and electrostatic map colored with APBS49 software. All-trans-retinal and Lys233 are shown as stick model. c, d Difference H-bond graphs illustrate the conserved and unique H-bonds of HcKCR1 and HcCCR. Gray dots (graph nodes) and lines (graph edges) indicate amino acid residues and their connections which are conserved (present) in both structures, whereas blue nodes and edges show amino acid residues and H-bonds which are unique to each structure. Red dots (nodes) are water molecules determined in the cryo-EM structures. The H-bond graphs were computed using Bridge21 and C-Graphs22 programs with a distance criterion of 4 Å between the H-bond donor and acceptor hetero-atoms. Bold edges indicate distances ≤ 3.5 Å. The H-bond graph is projected to a two-dimensional plane, where the vertical axis corresponds to the coordinates of the Cα atoms of the amino acid residues along the membrane normal (z coordinate), and the horizontal axis shows the Principal Component Analysis (PCA) projection along the membrane plane (xy coordinates). c Difference H-bond graph of HcKCR1 relative to the conserved H-bond graph. d Difference H-bond graph of HcCCR relative to the conserved H-bond graph.

