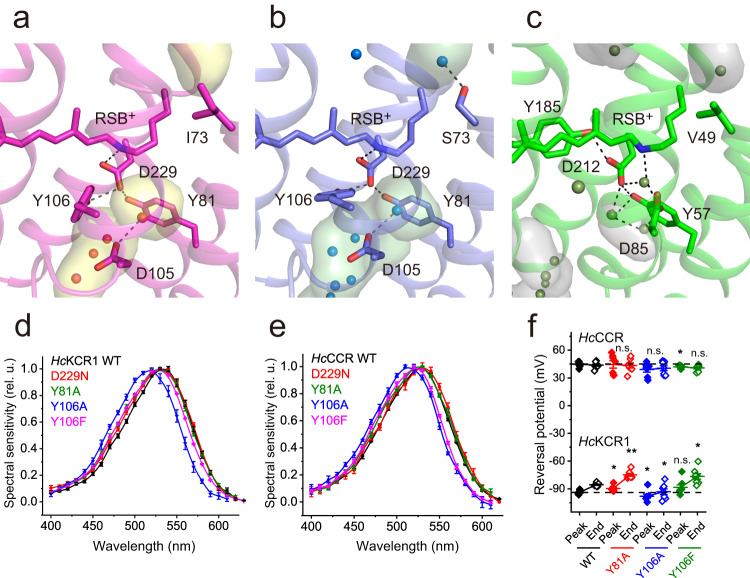
Fig. 5. Photoactive site.
Photoactive site near the retinal Schiff base (RSB+) of HcKCR1 (a), HcCCR (b), and Bacteriorhodopsin (c BR, PDB ID: 1C3W) colored in magenta, blue, and green, respectively, with the cavities colored in yellow, green, and grey. Key residues lining the cavities are displayed as stick models. Water molecules are represented by spheres. The black dashed lines indicate hydrogen bonds. The internal cavities modelled with the program HOLLOW50 are shown. The action spectra of photocurrents by HcKCR1 (d) and HcCCR (e) variants. The symbols are the mean values, the error bars, s.e.m. (n = 16 cells for HcCCR_D229N, 8 cells for HcCCR_Y106F, and 6 cells for other variants). f The reversal potentials (Vrev) of channel currents. The symbols (black for the wild types, red for the Y81A mutants, blue for the Y106A mutants and green for the Y106F mutants; filled for the peak currents and empty for the end currents) are the mean values, the error bars, s.e.m (n = 8 cells for HcKCR1_Y106F and WT HcCCR, and 7 cells for other variants). p = 0.02, 0.03 and 0.06 (peak currents) and 0.002, 0.04, and 0.01 (end currents) for HcKCR1_Y81A, Y106A and Y106A, respectively; 0.82, 0.08 and 0.04 (peak currents) and 1, 0.45, and 0.1 (end currents) for HcCCR_Y81A, Y106A, and Y106A, respectively by the two-sided Mann-Whitney test compared to the respective WT. n.s., not significant. Source data are provided as a Source Data file.

