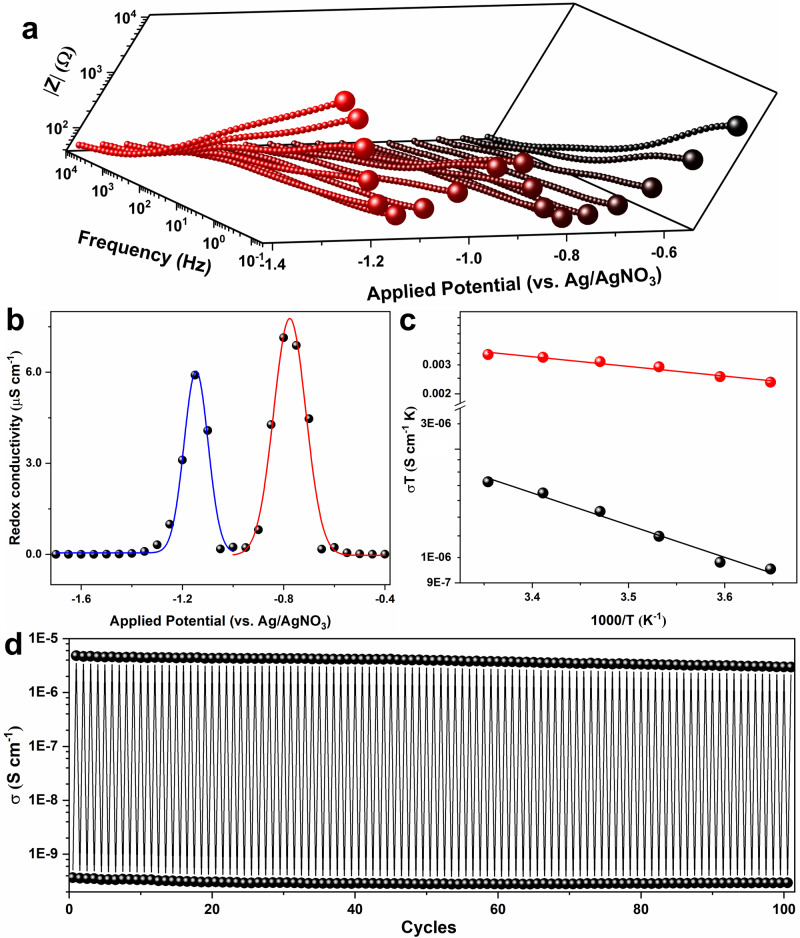
Fig. 3. Redox-conductivity characteristics of Zn(pyrazol-NDI) thin-films, together with activation barrier and conductivity switching measurements.
a Bode plots of Zn(pyrazol-NDI) thin-film at different applied potentials (the impedance data point at the frequency of 0.1 Hz was magnified for each measurements to highlight the effect of redox state); before each measurement, a stabilization time of 120 s was applied at respective potentials to achieve steady redox states. b Evolution of the steady-state thin-film conductivity as a function of applied electrochemical potential, which determines the mole fraction of electron reduction, x-Zn(pyrazol-NDI), 0.0 ≤ x ≤ 2.0, raw data is available in the source data file. Gaussian fit was performed for NDI/NDI•− based (red line) and NDI•−/NDI2− (blue line) bell-shaped redox conductivity. c Steady-state conductivity of 0.0-Zn(pyrazol-NDI) (black sphere) and 0.5-Zn(pyrazol-NDI) (red sphere) thin-films as the function of temperature, activation energy is derived based on the Arrhenius equation. d Switchability of the redox conductivity between 0.0-Zn(pyrazol-NDI) (bottom sphere) and 0.5-Zn(pyrazol-NDI) (top sphere) over 100 cycles (~24 h operation).

