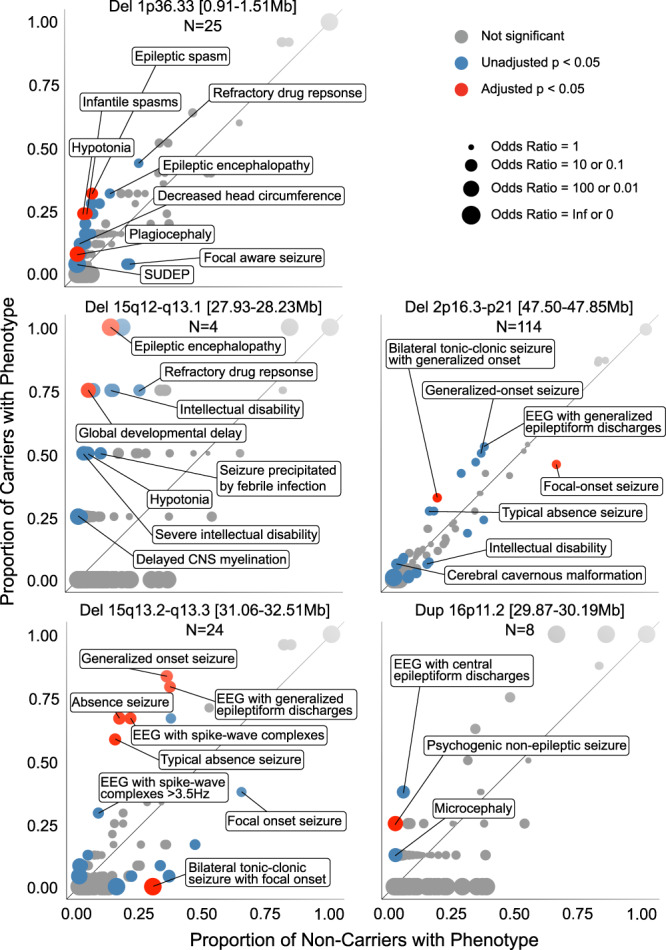
Fig. 2. Genotype-first phenomic analysis in 10,880 individuals with detailed clinical data.

For each CNV, the proportion of carriers and non-carriers annotated with each HPO concept is plotted. Those above the diagonal were enriched among carriers, and those below were depleted. Odds ratios are represented by dot size. The selected phenotypes labeled were prioritized according to statistical evidence and clinical breadth. Full results for all associations reaching unadjusted P < 0.05 are provided in Supplementary Data 3. SUDEP sudden unexpected death in epilepsy, CNS central nervous system, EEG electroencephalogram.
