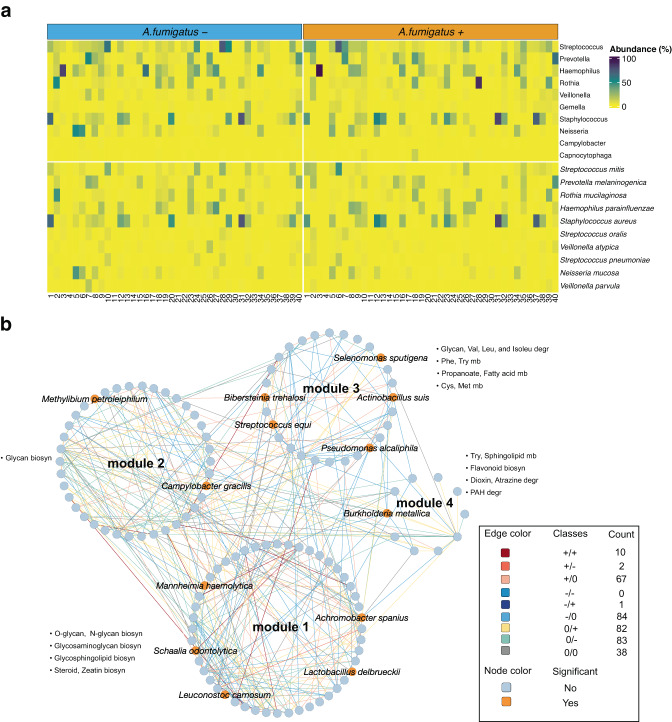
Fig. 4. Metagenomics sequencing of 80 total paired sputum samples taken from 40 cystic fibrosis patients before and after A. fumigatus colonization.
a Relative abundances of the 10 most abundant genera and species from all samples. X-axis is ordered by patient sample number. b Differential correlation analysis of species in A. fumigatus + (after colonization) relative to A. fumigatus - (before colonization) showing changes in the lung microbiome interactome after A. fumigatus colonization. Edge colors and class information indicate the direction of correlation for A. fumigatus -/A. fumigatus + . Associated count indicates the number of species pairs in the network exhibiting this pattern of change. Only species pairs with significant differential correlations were included (permutation test, p ≤ 0.05). An orange node background indicates significant differential abundance for species when comparing A. fumigatus - vs. A. fumigatus + samples (metagenomeSeq, zero-inflated Gaussian mixture model, p ≤ 0.05, Supplementary Data S6). Abbreviations: biosyn: biosynthesis; cys: cysteine; degr: degradation; Isoleu: isoleucine; met: methionine; mb: metabolism; Leu: leucine; Phe: phenylalanine; PAH: Polycyclic Aromatic Hydrocarbon; Try: tryptophan; Val: valine. Source data for Fig. 4 are provided in the Source Data file.

