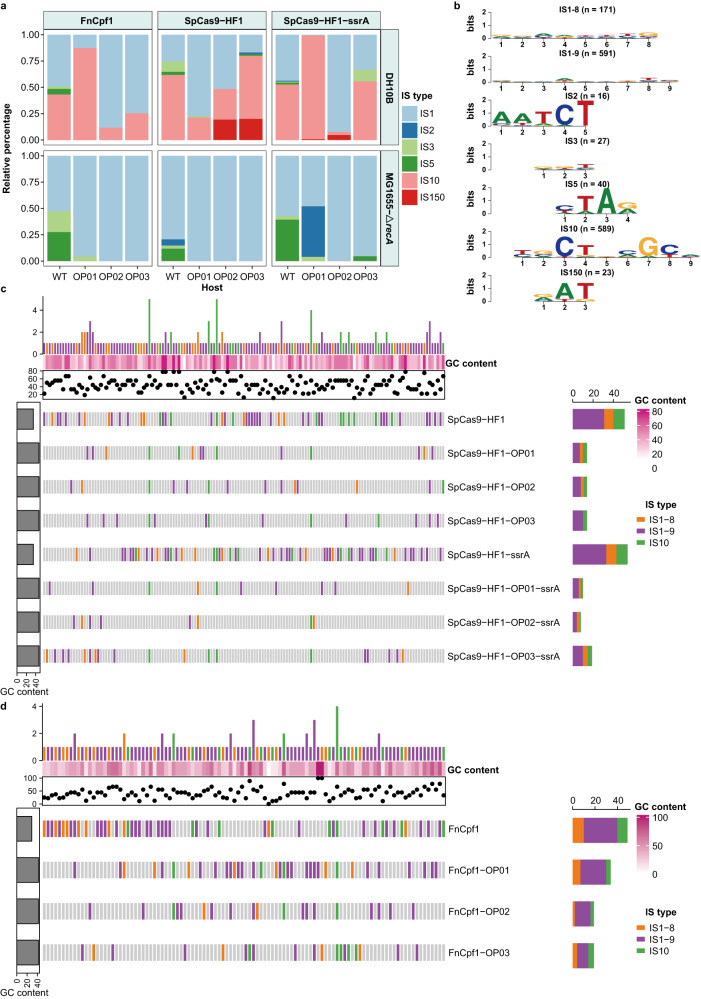
Fig. 5. Fitness consequences of IS-mediated trade-off by insertion into the cas gene.
a The stacked bar chart depicts the relative frequency of transpositions of each IS element (indicated by the different colors) into the coding regions of SpCas9-HF1, SpCas9-HF1-ssrA, FnCpf1, and their derivates within E. coli DH10B and MG1655-ΔrecA. Source data are provided as a Source Data file. b Based on Sanger sequencing results of all transposition fusions identified in a, consensus TSD motifs were constructed and are displayed as sequence logos for each IS type. Values within parentheses indicate the total number of TSDs detected for each IS type. c, d Comparative analysis of the diversity of IS transposition sites across the coding regions of SpCas9-HF1 (c), FnCpf1 (d), and their derivates. Vertical bars represent all unique positions of identified TSDs in the related genes, arranged from left to right in ascending order of the coordinates. Sites of TSDs generated by IS1-8 (8 bp TSD of IS1), IS1-9 (9 bp TSD of IS1), and IS10 are marked by vertical bars of orange, purple, and green, respectively. Gray vertical bars indicate that no IS insertions were observed at the site. The GC content of each TSD is represented by a dot on the scatter plots, and the color scale in the heat maps (rows of white to dark pink bars) indicates the level of GC content. The bar chart above each heat map illustrates the number of genes sharing the same TSD site, and the bar chart on the right shows the number of unique TSD sites identified in each gene. The leftmost bar represents the GC content for each gene sequence.

