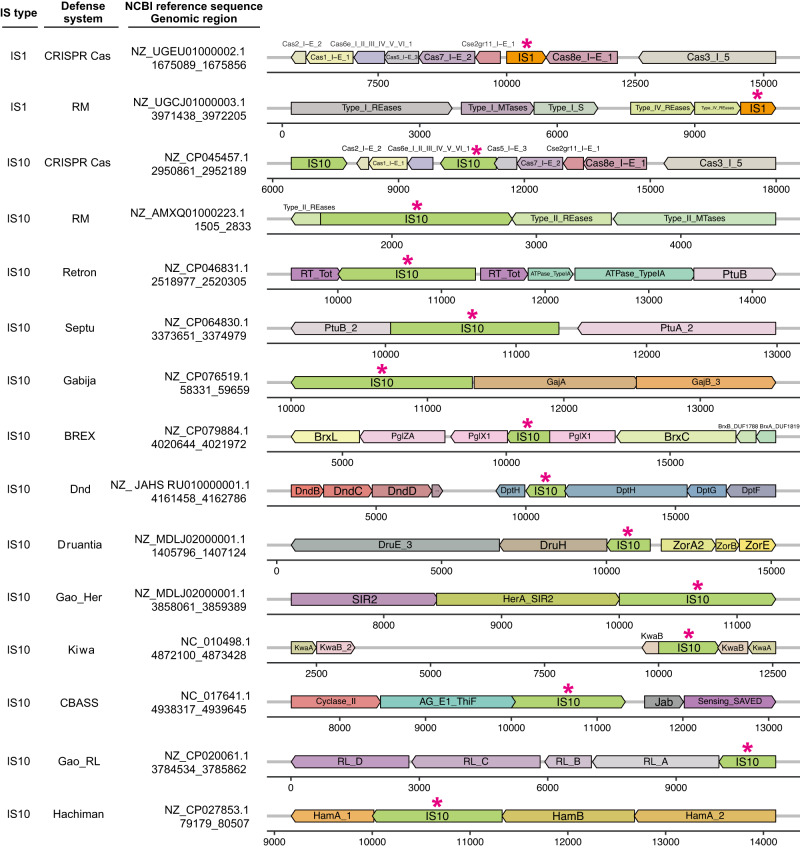
Fig. 8. Defense systems compromised by IS1 and IS10 transpositions.
Representative examples of each defense system (listed in second column) are shown. Each row represents a specific transposition event, and the NCBI reference number of each target sequence and coordinates of IS transposition are indicated in the third column. Defense system genes were annotated by DefenseFinder. The orientation of genes and embedded ISs are indicated by colored arrows in either the forward or reverse direction. Horizontal axes indicate the relative position of each gene or IS within the targeted genomic region. For all identified transposition events, see Fig. S22.

