
Fig. 3. Excitation spectra.
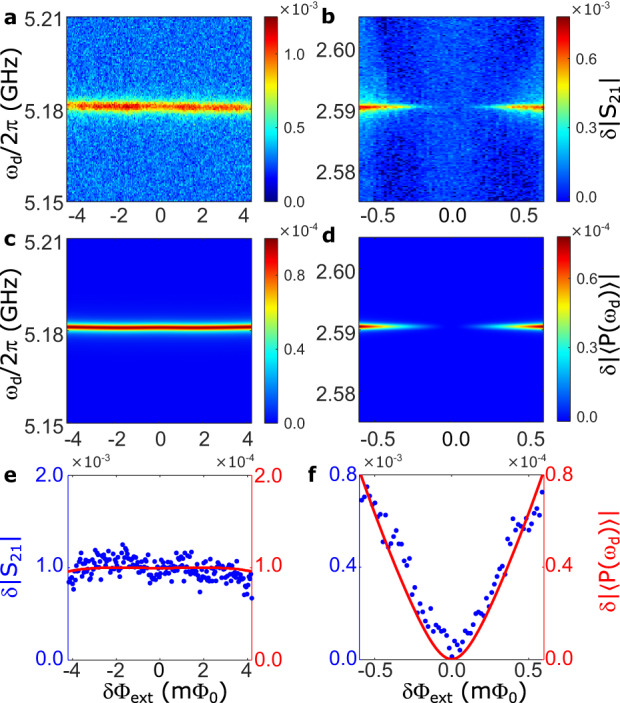
Excitation spectra of the Xmon qubit versus the external flux bias δΦext and the drive frequency ωd around . The frequency of the probe tone is fixed at 3.554 GHz, in resonance with the λ/2 mode of the coplanar-waveguide resonator. a and b show the experimental results, corresponding to the single- and two-photon transitions of the Xmon qubit with frequencies ωX and , respectively. c and d show the simulated results. The theoretical calculations display the changes in the amplitude of the Xmon polarization ∣〈P(ωd)〉∣. Loss rates for the flux qubit, lumped-element resonator, and Xmon are chosen to be γ(q)/2π = γ(a)/2π = γ(b)/2π = 2 MHz, for simplicity and to be consistent with the observed linewidth in a. e, f Cross sections along the excitation spectra in a (b) and c (d) when ωd/2π = 5.181 GHz (2.5905 GHz). Source data are provided as a Source Data file.