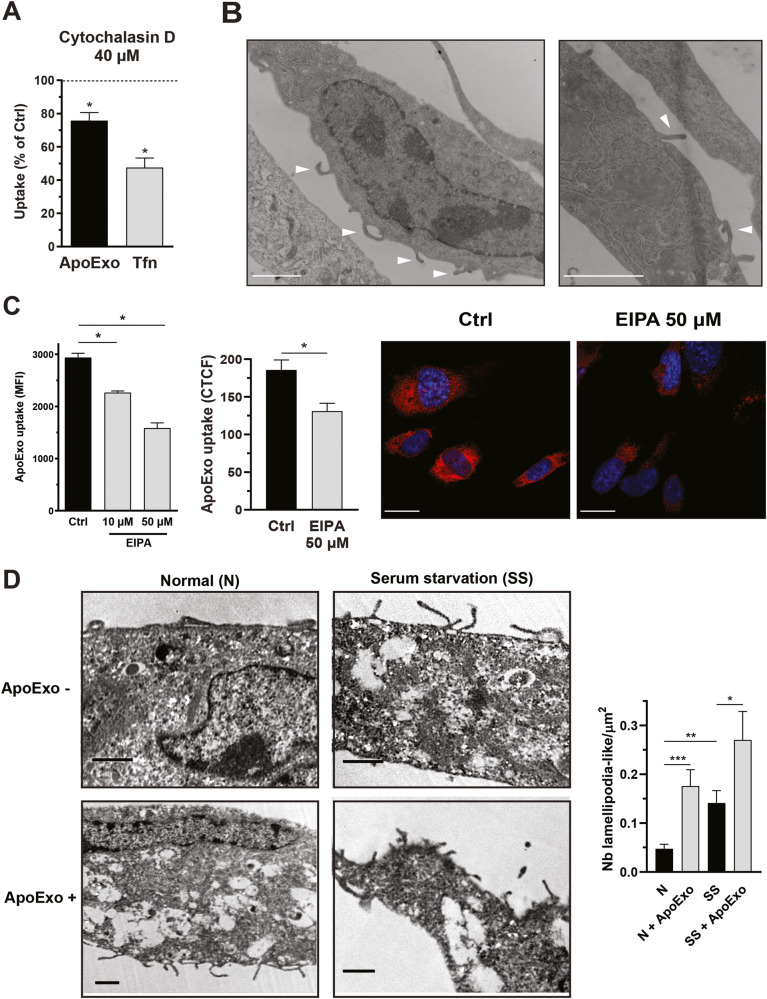
Fig. 5. Apoptotic exosome-like vesicles are internalized by endothelial cells through macropinocytosis.
A Cytoskeleton dynamics inhibition suppressed ApoExo uptake by endothelial cells. Quantification of ApoExo uptake and transferrin (Tfn) uptake by flow cytometry in serum-starved endothelial cells pretreated for 30 min with 40 µM cytochalasin D or vehicle (DMSO; Ctrl) followed by treatment for 1 h. n = 3 for each condition. B Endothelial cells displayed macropinosome formation. Representative electron micrograph showing macropinosome formation (arrow) in endothelial cells after serum starvation for 2 h. Scale bar: 2 µm, n = 3. C Macropinocytosis inhibition suppressed ApoExo uptake by endothelial cells. Quantification of Apex uptake in serum-starved endothelial cells pretreated for 30 min with 10 and 50 µM EIPA or its vehicle (DMSO; Ctrl) followed by treatment for 1 h as determined by flow cytometry (left) and confocal microscopy (right) in. n ≥ 3 for each condition. Flow cytometry data are expressed as the median fluorescence intensity (MFI) (30,000 events/sample) ± SEM. Confocal microscopy experiment data are expressed as corrected total cell fluorescence (CTCF) ± SEM. Representative pictures of ApoExo internalization by confocal microscopy. (Scale bar: 20 µm; red—ApoExo and blue—nucleus). D ApoExo treatment induced lamellipodium-like structure formation in both normal (N) and serum-starved (SS) cells after 1 h. n ≥ 5 for each condition from a single experiment. Representative electron micrographs showing an increased number of lamellipodium-like structures for each condition. Macropinocytosis is observed following invagination of the cell membrane by mobilization of actin filaments to form protrusions that fold over the plasma membrane to form a macropinosome. TEM images show the number of structures per cell surface ± SEM. Scale bar: 1 µm. P values were obtained by unpaired t test (*P < 0.05, **P < 0.01, and ***P < 0.001).

