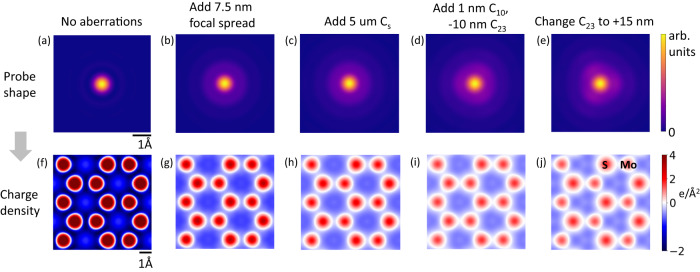
Fig. 3. Effect of probe shape and residual aberrations on the charge density image.
Simulated probe shapes (a–e) and net charge density images (f–j) while successively adding various aberrations: a, f a 30 mrad probe at 80 kV with no chromatic or geometric aberrations. b, g Adding chromatic aberrations (7.5 nm FWHM focal spread). c, h Adding 5 µm 3rd order spherical aberrations, Cs (also known as C30). d, i Adding 1 nm C10 (negative defocus), −10 nm C23 (threefold astigmatism). e, j Changing C23 to +15 nm. Images (a–e) share the same scale bar as in (a), and images (f–j) share the same scale bar as in (f).

