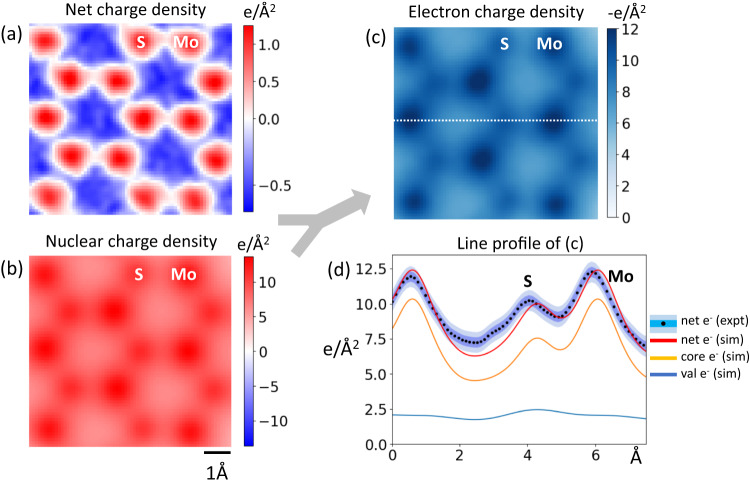
Fig. 5. Deriving the electron charge density from experimental data.
a Experimental electron charge density. b Reconstructed nuclear charge density with probe convolution. c Experimental electron charge density derived by subtracting (b) from (a). d Line profiles for the experimental electron charge density and simulated charge density from Fig. 4f, showing the contributions of valence and core electrons to the overall electron charge density. The light and dark blue shaded regions indicate one and two standard deviation(s) on either side of the mean, respectively. All images share the same scalebar with (b).

