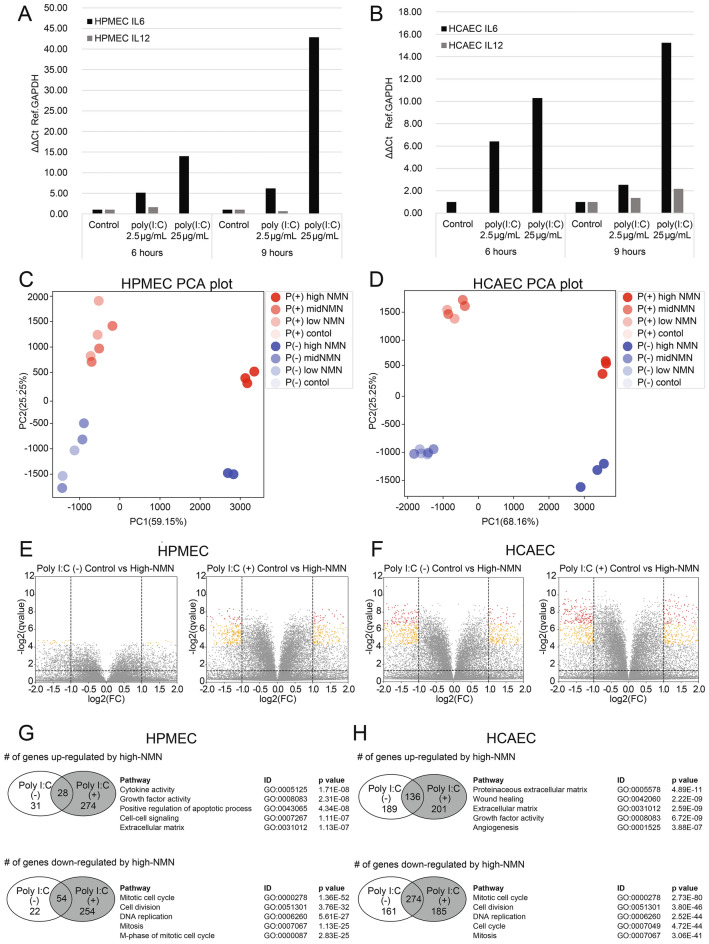
Figure 1.
Changes in gene expression levels according to poly(I:C) activation condition and NMN dose. IL6 and IL12 expression levels after control, poly(I:C) (2.5 µg/mL), and poly(I:C) (25 µg/mL) treatment for 6 h and 9 h in HPMECs (A) and in HCAECs (B). PCA plot of expression profiles after poly(I:C) (2.5 µg/mL) activation (red) and without poly(I:C) activation (blue) in HPMECs (C) and HCAECs (D). Volcano plots of differentially expressed genes (DEGs) between control and high-dose NMN treatments in non-poly(I:C)-activated and poly(I:C)-activated HPMECs (E) and non-poly(I:C)-activated and poly(I:C)-activated HPMECs (F). Number of genes upregulated or downregulated under poly(I:C)-activated conditions via high-dose (10 mM) NMN and list of pathways overrepresented in HPMECs (G) and HCAECs (H).

