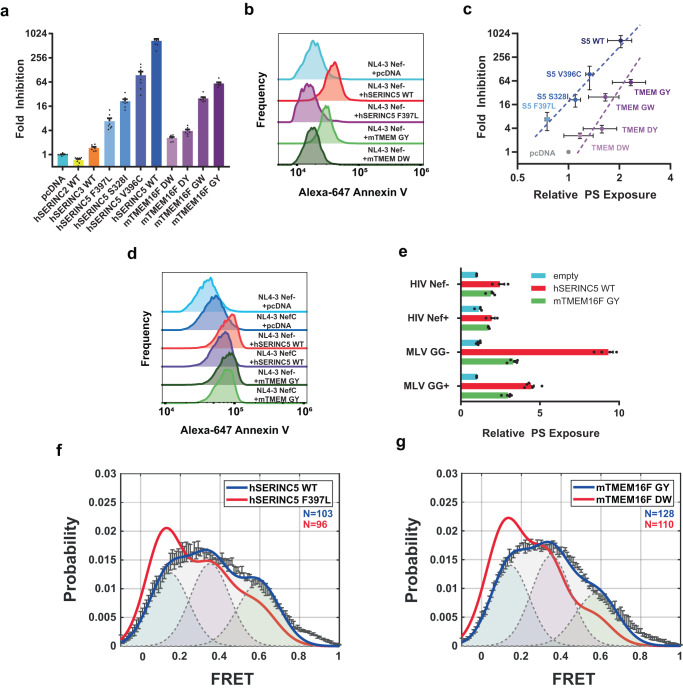
Fig. 4. PS exposure by hSERINC5 on virus particles correlates with inhibition of infectivity and conformational changes in Env and is antagonized by HIV-1 Nef and MLV GlycoGag.
a HIV-1NL4-3ΔNef particles were produced in the presence of indicated plasmids and titered on TZM-Bl indicator cells by luciferase assay. Results represent the mean of n = 7 independent experiments ± SEM. b HIV-1NL4-3ΔRTΔNef virus particles containing Gag-GFP and CD63-mRFP were produced in the presence of indicated hSERINC5 or mTMEM16F plasmid, bound to anti-CD63 magnetic beads, stained with Alexa647-annexin V, and imaged by flow cytometry. Histograms depict annexin V intensity for the GFP-positive population. Results reflect one representative experiment of n = 3 biological replicates. c PS exposure was assessed as in (b) and plotted in relation to virus infectivity as in (a) for the indicated hSERINC5 (S5) or mTMEM16F proteins. Values represent mean ± SD from n = 3 independent experiments. d HIV-1NL4-3ΔNef or NefC-expressing virus particles were produced in the presence of indicated hSERINC5 or mTMEM16F plasmid and analyzed as in (b). Histograms depict annexin V intensity for the GFP-positive population from one representative of n = 3 independent experiments. e Annexin V mean fluorescence intensity is shown for HIV-1 particles ± Nef as in (d). Values represent the mean ± SEM from n = 3 independent experiments. Percent annexin V-positive MLV particles imaged by confocal microscopy as in (Supplementary Fig. 9). Values represent the mean ± SEM from five independent experiments. f HIV-1NL4-3ΔRTΔNef virus particles were produced in the presence of WT hSERINC5 or the F397L mutant and the conformational state of HIV-1 Env was analyzed by single-molecule FRET (see also Supplementary Fig. 10). N is the number of individual dynamic molecule traces complied into a population FRET histogram (gray lines) and fitted into a three-state Gaussian distribution (solid) centered at ~0.15-FRET, ~0.35-FRET, and ~0.6-FRET. Histogram error bars represent the mean FRET probabilities ± SEM. g HIV-1NL4-3ΔRTΔNef virus particles were produced in the presence of mTMEM16F GY (blue) or mTMEM16F DW (red) and the conformational state of HIV-1 Env was analyzed by single-molecule FRET as in (f). Source data are provided as a Source data file.

