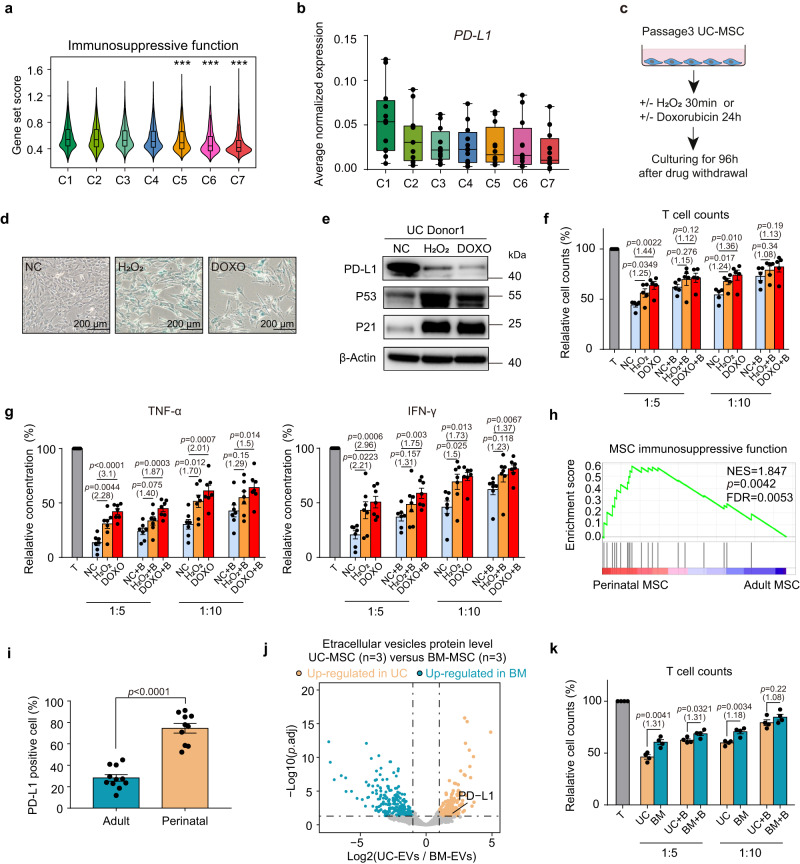
Fig. 4. Cellular senescence status determines the PD-L1 expression and immunosuppressive function of human MSCs.
a Violin plots showing the average expression of immunosuppressive functional genes for each cluster. Asterisks on specific groups represent significant differences compared with clusters C1, C2 and C3, p values were generated by two-sided one-way ANOVA with Tukey’s multiple comparisons test. (***p < 2.2 × 10⁻¹⁶, n = 45,955 biologically independent cells) b Box plot showing the average expression of PD-L1 in each cell cluster of all samples (n = 12 independent samples per group). Each dot represents the average normalized expression value of PD-L1 from Seurat RNA assay. c Experimental design. d SA-β-gal staining in MSCs. Scale bar, 200 µm. Data represent one independent experiment. e Western blot analysis of PD-L1, P53 and P21 protein in MSCs, represent one independent experiment. f Bar plots represent cell counts of CD4+ T cells cocultured with normal control (NC), H2O2-treated or doxorubicin-treated MSCs (n = 5 independent experiments). g ELISA of TNF-α (left) and IFN-γ (right) levels in the coculture supernatant. Data represent 5 independent experiments (n = 7 independent samples each group). h GSEA indicating the significantly enriched immunosuppressive function of perinatal MSCs. The p-value was determined by one-sided permutation test, comparing observed NES with a null distribution. FDR was controlled using the Benjamini-Hochberg method. i Flow cytometry analysis showing PD-L1 expression among adult (nAD = 6 independent samples; nBM = 5 independent samples) and perinatal MSCs (nPM = 5 independent samples, nUC = 5 independent samples). j Volcano plot showing the differentially expressed proteins in UC- and BM-EVs (Log-transformed fold change >1; p.adj <0.05). k Cell counts of CD4+ T cells cocultured with BM- or UC-MSCs (n = 4 independent experiments). All box plots indicate median values, and the 25th to 75th percentiles. All bar plots represent the means ± SEM. For f, g and k, CD4+ T cells cocultured with MSCs at a 5:1 or 10:1 ratio in the presence of isotype or PD-L1 blocking antibody (+ B), multiples of the mean values between the two groups are marked in parentheses below the p-values. For f, g, i and k, p-values were determined by two-tailed unpaired Student’s t-test. Source data are provided as a Source Data file.

