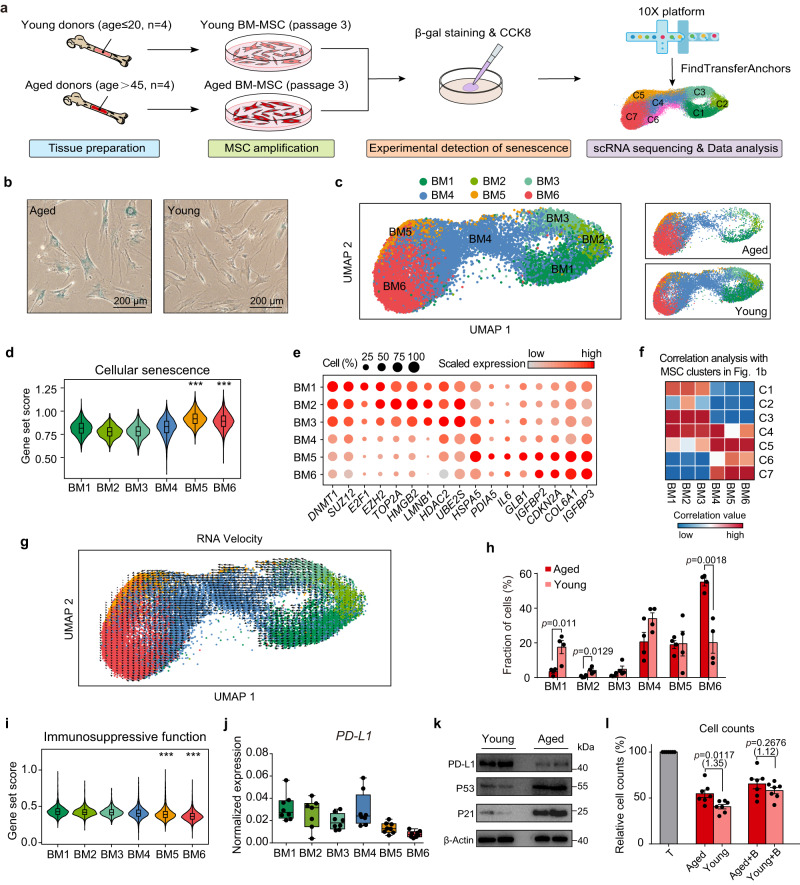
Fig. 5. Cellular senescence reduced the immunomodulatory capacity of BM-MSCs derived from aged donors.
a Experimental design. b SA-β-gal staining in young and aged BM-MSCs, representative of one independent experiment. Scale bar, 200 µm. c UMAP showing six clusters of BM-MSCs. MSCs were projected together by UMAP (left) and displayed separately by age of donors (right). d Violin plots showing average expression of cellular senescence genes for each cluster. e Dot plots showing the scaled expression of representative senescent-related genes for each cluster. Color represents the scaled expression values from Seurat RNA assay. f Correlation matrices showing the Pearson correlation coefficients of the 6 BM-MSC clusters and 7 MSC clusters as shown in Fig. 1b. g RNA velocity analysis of BM-MSCs from young and aged donors. h Fractions of subpopulations in aged and young MSC samples, p values were generated by two-tailed t-test with Welch’s correction (n = 4 independent samples each group). i Violin plots showing average expression of immunosuppressive function genes for each cluster. j Box plot showing the pseudobulk PD-L1 expression in each cell cluster (n = 8 independent samples per cluster). Each dot represents the average normalized expression value of PD-L1 from Seurat RNA assay. k Western blot analysis of PD-L1, P53 and P21 protein in young (n = 2) and aged (n = 2) BM-MSCs, represent one independent experiment. l Cell counts of CD4+ T cells cocultured with young and aged BM-MSCs in the presence of isotype or PD-L1 blocking antibody (+ B). Data are representative of 3 independent experiments (n = 7 independent samples each group). The p values were generated by two-tailed unpaired Student’s t-test. Multiples of the mean values between the two groups are marked in parentheses under the p-values. All box plots indicate median values, and the 25th to 75th percentiles. All bar plots represent the means ± SEM. For d and i, p values were generated by two-sided one-way ANOVA with Tukey’s multiple comparisons test, asterisks on specific group represent there were statistical differences compared with cluster BM1, BM2 and BM3. (***p < 2.2 × 10⁻¹⁶; n = 31,907 biologically independent cells). Source data are provided as a Source Data file.

