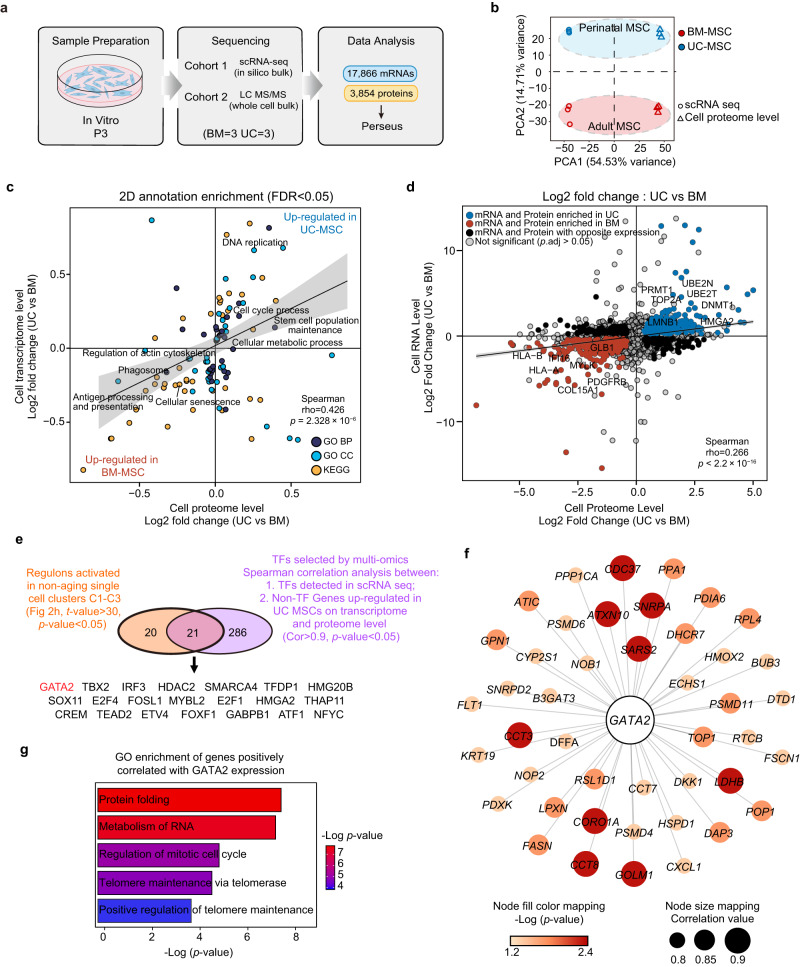
Fig. 6. Integrated analysis of single-cell transcriptomic and proteomic data identifies GATA2 as a key regulator of MSC senescence.
a Experimental workflow used to analyze the transcriptome and proteome of MSCs. b In silico bulk (scRNA-seq) data were merged with proteome data (mass spectrometry) and subjected to principal component analysis. The first principal component shows clustering by data modality. The second principal component separates perinatal and adult MSCs across two data modalities. c Scatter plot showing the result of the two-dimensional annotation enrichment analysis based on fold changes in the proteome (x-axis) and transcriptome (y-axis). The significant positive correlation of both datasets was calculated by Spearman’s test, p values were computed using two-sided algorithm AS 89 (n = 114 pathways; Supplementary Data 11). d Scatter plot showing the results of differential expression analysis based on fold changes in the proteome (x-axis) and transcriptome (y-axis). The differential expressed genes or proteins were calculated by two-tailed Wald test and adjusted using Benjamini-Hochberg FDR correction (n = 3 independent samples for each group). The significant positive correlation of both datasets was calculated by Spearman’s test, p values were computed using two-sided asymptotic t approximation (n = 3,664 genes; Supplementary Data 10). e Venn diagram showing the overlap of TFs between the top activated regulons in clusters C1-C3 (t-value > 30; p value < 0.05) and TFs significantly correlated with upregulated proteins in UC-MSCs (Cor > 0.9, p value < 0.05). f Protein–protein interaction (PPI) network representing GATA2 positively correlated non-TF genes, which were upregulated in UC-MSCs on both transcriptome and proteome level. The color of the nodes represents -Log(p-value) and the size of the nodes represents correlation value. g Bar plot representing enriched GO pathways of the GATA2 positively correlated non-TF genes.

