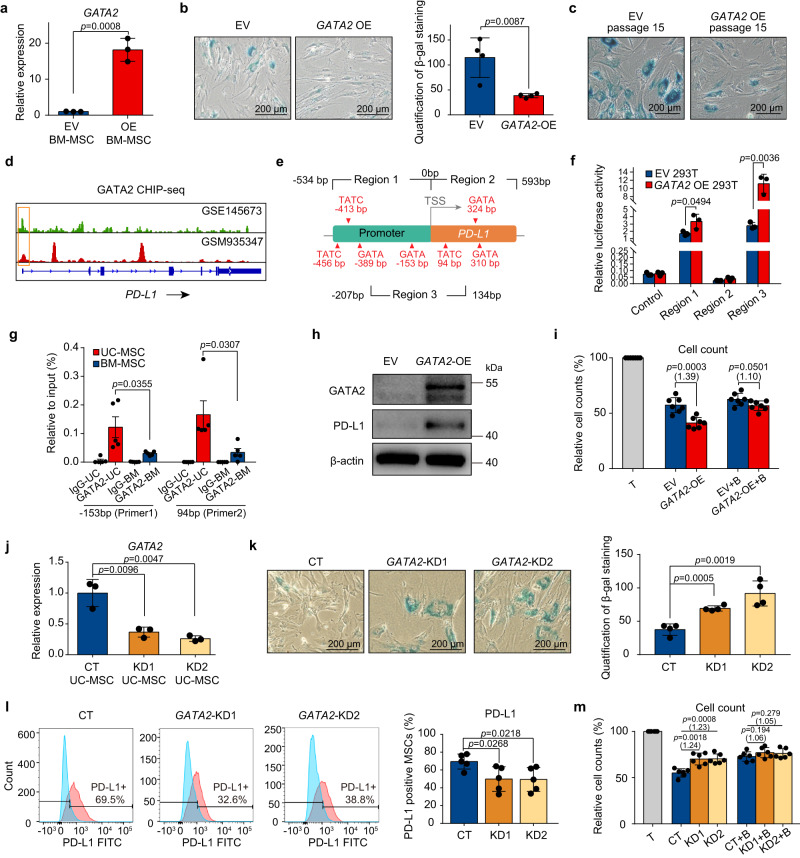
Fig. 7. GATA2 enhance the anti-senescence ability of MSC and restore their immunosuppressive function.
a qPCR analysis of GATA2 expression in BM-MSCs upon lentivirus-mediated gene overexpression (n = 3 independent experiments). b (left) SA-β-gal staining in BM-MSCs, represent one independent experiment. Scale bar, 200 µm. (right) Quantification of SA-β-gal-positive MSCs, represent three independent experiments (n = 4 independent samples per group). c SA-β-gal staining in EV or GATA2-OE BM-MSCs cultured to passage 15. Scale bar, 200 µm. Data represent one independent experiment. d Representative GATA2 occupancy plots of PD-L1 genes from the ChIP-seq datasets. e Experimental design. f Bar plot showing the luciferase activity of 293 T cells co-transfected with dual-luciferase reporter, as well as EV or GATA2 (n = 3 independent experiments). g qPCR results were used to quantify enrichment of GATA2 at the PD-L1 promoter using ChIP-assay, pooled from three independent experiments. (n = 5 independent samples each group). h Western blot analysis of GATA2 and PD-L1 protein in EV and GATA2-OE BM-MSCs, represent one independent experiment. i Cell counts of CD4+ T cells cocultured with EV or GATA2-OE MSCs (n = 7 independent samples each group). j qPCR analysis of GATA2 expression in UC-MSCs after transfection with scramble- or GATA2-shRNA. (n = 3 independent experiments). k (left) SA-β-gal staining in UC-MSCs, representative of one independent experiment. Scale bar, 200 µm. (right) Quantification of SA-β-gal-positive MSCs are shown in the bar plot, represent three independent experiments (n = 4 independent samples each group). l (left) Representative flow cytometry plots. (right) Bar plot showing PD-L1 expression on CT or GATA2-KD UC-MSCs, pooled from three independent experiments (n = 5 independent samples each group). m Cell counts of CD4+ T cells cocultured with CT or GATA2-KD MSCs (n = 6 independent samples each group). For g, bar plots represent the means ± SEM. All other bar plots represent the means ± SD. For i and m, data represent three independent experiments, T cells were co-cultured with MSCs in the presence of isotype or PD-L1 blocking antibody (+ B), multiples of the mean values between the two groups are marked in parentheses. All p-values were generated by two-tailed unpaired Student’s t-test. Source data are provided as a Source Data file.

