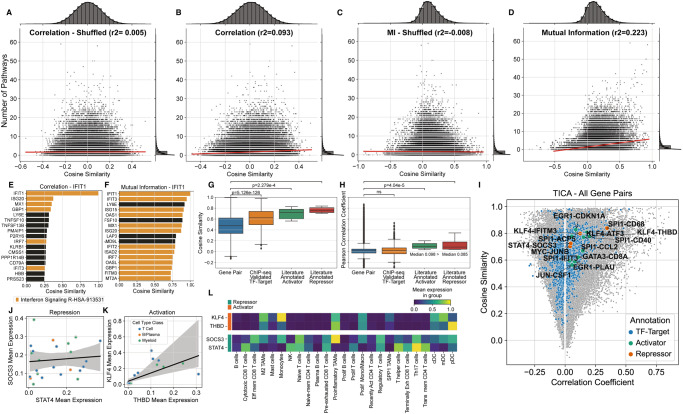
Fig. 2. Comparison of Results using Mutual Information.
A–D Pathway co-membership vs. cosine similarity between gene vectors for all gene pairs in PBMCs. Each point represents one gene pair, and plots show the number of pathways (combined Reactome and MSigDB cell type signatures [C8]) that contain both genes (y-axis) and the cosine distance between the two genes (x-axis). The results show both correlation A, B and MI (Mutual Information) C, D based GeneVector. In addition to a standard set of results B, D, a baseline relationship between pathway co-membership and cosine similarity is established by performing an identical analysis over randomly shuffled gene A, C. E Top 16 most similar genes by cosine similarity to IFIT1 using correlation coefficient. Genes in the interferon signaling pathway are colored orange. F Top 16 most similar genes to IFIT1 after training GeneVector using mutual information shows a higher number of interferon signaling pathway genes. G, H Cosine similarity and Pearson correlation coefficient for un-annotated gene pairs (n = 314090), ChIP-Seq annotated TF-targets pairs (n = 1275), and literature annotated activator (n = 26) or repressor (n = 26) TF-target pairs. The center of the box plot is denoted by the median, a horizontal line dividing the box into two equal halves. The bounds of the box are defined by the lower quartile (25th percentile) and the upper quartile (75th percentile). The whiskers extend from the box and represent the data points that fall within 1.5 times the interquartile range (IQR) from the lower and upper quartiles. Any data point outside this range is considered an outlier and plotted individually. Significance assessed using Mann-Whitney-Wilcoxon two-sided test. I Cosine similarity versus correlation coefficient for gene pairs in the TICA (Tumor Immune Cell Atlas) dataset with TF-target gene pairs highlighted (blue) and colored by activator/repressor status (green/orange respectively). J, K Linear regression of mean log-normalized expression per cell type±95% confidence interval for repressor TF-target pair SOCS3-STAT4 and activator TF-target pair KLF-THBD, respectively. L Mean log-normalized expression for SOCS3-STAT4 and KLF4-THBD across annotated cell types. Source data provided as a Source Data file.

