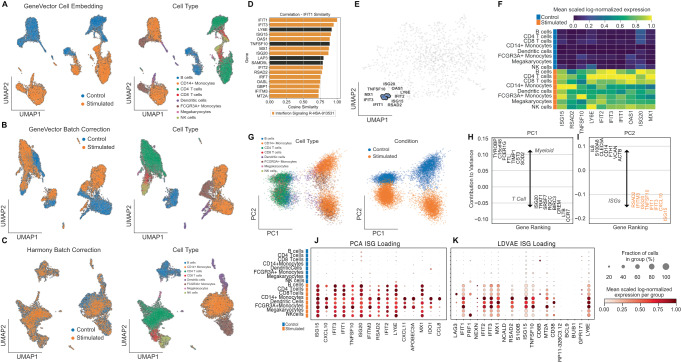
Fig. 4. Comparing Methods with Interferon Beta Stimulated 10 K PBMC.
A Uncorrected GeneVector UMAPs showing stimulated condition (left) and cell type annotation (right) on 10k PBMCs with control and interferon beta stimulated cells. B GeneVector batch corrected UMAPs showing stimulated condition (left) and cell type annotation (right) indicated stronger interferon-beta stimulated response in myeloid cells. C Harmony batch correction applied to normalized expression eliminates all variation related to interferon beta stimulation. D Most similar genes by cosine similarity to IFIT1 includes genes found in Reactome interferon related pathways. E Gene embedding UMAP highlighting an ISG (interferon stimulated genes) metagene that includes genes most similar to IFIT1. F Scaled log-normalized expression of ISG (interferon stimulated gene) metagene shows increased expression across stimulated cells without cell type specific effects. G PCA embedding colored by cell type (left) and stimulation (right). H Top genes by contribution to variance indicates PC1 defines cell type. I Top genes by contribution to PC2 defined by ISG stimulation colored by scaled normalized, log-transformed gene expression scaled by variable. J, K Scaled normalized, log-transformed expression scaled by variable of ISG related loadings from PCA (left) and LDVAE (right) includes cell type specific markers intermixed with ISGs. Source data provided as a Source Data file.

