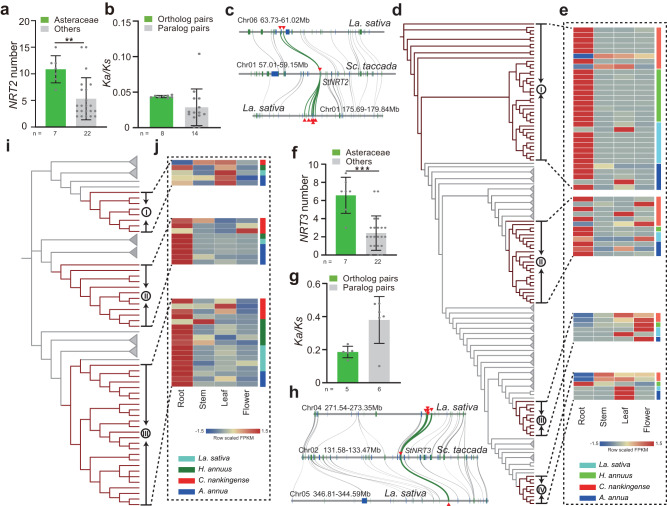
Fig. 4. Expansion and preferential retention of N uptake genes in Asteraceae.
a, f Number of genes for the Nitrate transporter 2 (NRT2) and NRT3 families in Asteraceae and other terrestrial plant species. **P < 0.01 and ***P < 0.001, as determined by two-tailed Student’s t test. The number (n) of data point for each group was shown below. Data are presented as mean values +/−SD. b, g Ka/Ks value of orthologous gene pairs (Sc. taccada versus La. sativa) and paralogous gene pairs (La. sativa versus La. sativa) of clade I NRT2 (d) and clade III NRT3 (i) members. c, h Microsynteny visualization of clade I NRT2 (d) and clade III NRT3 (i) syntelogs in the Sc. taccada and La. sativa genomes. NRT2 and NRT3 orthologous pairs are highlighted with green lines. d, i Simplified phylogenetic tree of NRT2 (d) and NRT3 (i) in Asteraceae species and other species. The genes from the Asteraceae species are marked by dark red, while clades from other species are collapsed. e, j NRT2 (e) and NRT3 (j) expression in different tissues of four representative Asteraceae species. The FPKM values of genes in different tissues are scaled by rows to emphasize the tissue with the highest expression. Source data are provided as a Source data file.

