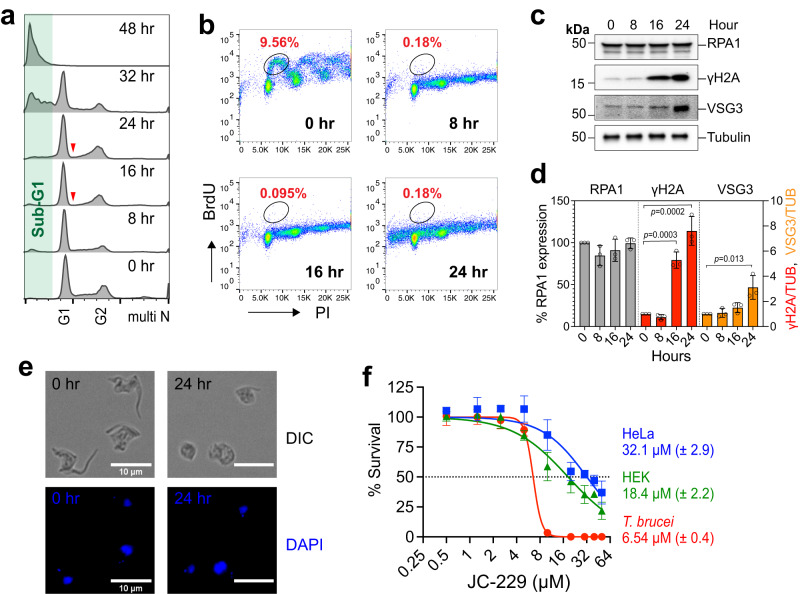
Fig. 3. JC-229 treatment mimics TbRPA1 depletion and is more toxic to T. brucei than human cells.
a Cell-cycle profiles of JC-229-treated T. brucei cells. WT T. brucei cells were treated with 10 μM of JC-229 and collected at indicated time points. Cells were fixed, stained with PI, and analyzed by flow cytometry. b DNA synthesis assay by BrdU pulse labeling. T. brucei cells treated with 10 µM JC-229 for 0, 8, 16, and 24 h were pulse-labeled with BrdU as shown in Fig. 2e. Cells were fixed, stained with PI and anti-BrdU-Alexa 488 antibody, and then analyzed by flow cytometry. c Immunoblots showing the levels of TbRPA1, γH2A, VSG3, and Tubulin proteins in cells treated with JC-229 for indicated hours. Tubulin serves as a loading control. d Quantification of protein levels in immunoblots. Signal intensities of protein bands were quantified using ImageJ software, normalized to those of Tubulin bands. Three independent experiments were performed (n = 3) and fold changes relative to the untreated samples were plotted. Error bars indicate mean ± SD. An unpaired two-sided Student’s t-test was performed. e Microscopic analysis of JC-229 treated T. brucei cells. Cells collected at indicated time points were fixed in 1% paraformaldehyde for 10 min and stained with DAPI. Images were obtained using an EVOS M5000 microscope. Scale bar, 10 µm. Twenty images were taken for each time point with similar results. f Cytotoxicity of JC-229 on T. brucei and two human cell lines (HeLa and HEK293). A dose-response curve was obtained from cells treated with increasing concentrations of JC-229 (0.5, 1.25, 2.5, 5, 10, 20, 30, 40, and 50 μM) for 72 h. Three biological replicates were used for each measurement (n = 3) and EC50 values were obtained from GraphPad Prism software (inhibitor vs. normalized response with variable slopes). Error bars indicate mean ± SD. Source data are provided as a Source Data file.

