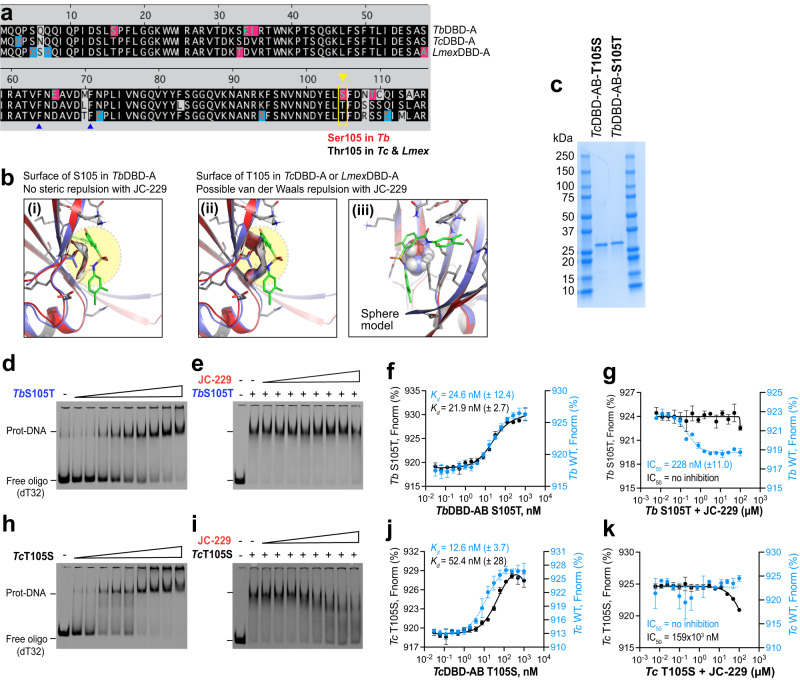
Fig. 7. DBD-A of T. brucei RPA1 has the JC-229 binding pocket and S105 is important.
a Sequence comparison of DBD-A domains of Tb, Tc, and Lmex RPA1. S105 of TbRPA1 DBD-A and T105 of Tc and LmexRPA1 DBD-A are shown. b Binding position of JC-229 with the surface of S105 in DBD-A of TbRPA1 is shown in (i). The binding position of JC-229 with T105 in DBD-A of Tc and LmexRPA1 are shown (ii: ribbon and iii: sphere model). c An SDS-PAGE gel showing purified fractions of TbRPA1 DBD-AB S105T and TcRPA1 DBD-AB T105S mutant proteins (a representative of three gels). d, e EMSA was performed as described in Fig. 4. d ssDNA-binding activity of TbRPA1 DBD-AB S105T mutant. e Inhibition of ssDNA-binding activity of Tb S105T mutant by JC-229. f, g The MST assay was performed on recombinant TbRPA1 DBD-AB S105T as described in Fig. 5. f ssDNA-binding activity of TbRPA1 DBD-AB S105T mutant. g Inhibition of ssDNA binding activity of Tb S105T mutant by JC-229 (30 nM protein used). h, i EMSA assay. h ssDNA-binding activity of TcRPA1 DBD-AB T105S mutant. i Inhibition of the ssDNA-binding activity of Tc T105S mutant by JC-229. Three independent EMSA experiments were performed for Fig. 7d, e, h, i with similar results. j, k MST assay. j ssDNA-binding activity of TcRPA1 DBD-AB T105S mutant. k Inhibition of ssDNA-binding activity of Tc T105S mutant by JC-229 (30 nM protein used). MST data of WT TbRPA1 DBD-AB from Fig. 5 and WT TcRPA1 DBD-AB from Fig. 6 are overlaid for comparison (blue dotted lines and circles in Fig. 7f, g, j, k). Three independent MST experiments were performed for Fig. 7f, g, j, k (n = 3). Error bars indicate mean ± SD. Statistical analysis and plotting of MST data were performed with GraphPad Prism software. Kd and IC50 values were obtained with one site binding total and standard 4-PL curve, respectively. Source data are provided as a Source Data file.

