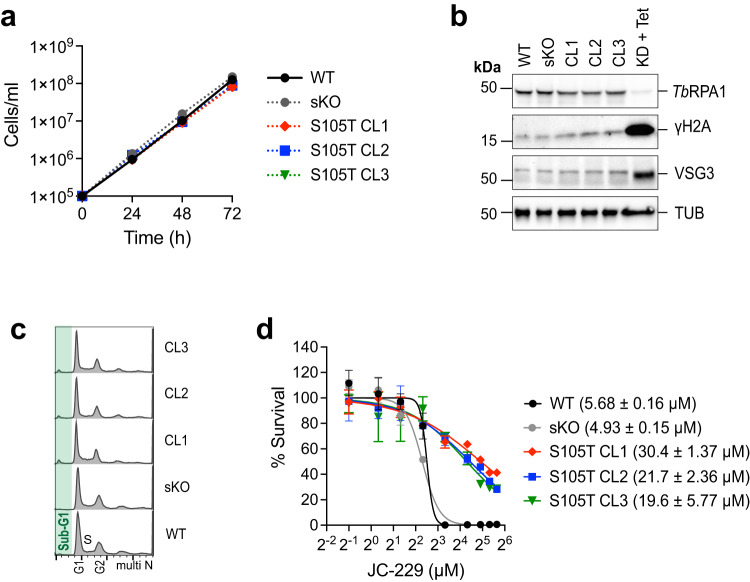
Fig. 8. T. brucei cells expressing TbRPA1-S105T mutant are resistant to JC-229.
a Growth of WT, single knock-out (sKO), and S105T mutant trypanosome cells. Cell growth was monitored by counting cells every 24 for 72 h. Three technical replicates were used for each measurement (n = 3). Error bars indicate mean ± SD. b Immunoblot controls presenting the changes in protein levels for TbRPA1, γH2A, VSG3, and Tubulin. Tubulin serves as a loading control. TbRPA1-depleted cells (48 h after Tet addition) serves as a control. Three independent experiments were performed with similar results. c Cell-cycle profiles of TbRPA1-S105T mutants. Fixed cells were stained with PI and analyzed by flow cytometry (ungated). d Cytotoxicity of JC-229 on T. brucei RPA1 S105T mutant cells, sKO and WT cells. A dose-response curve was obtained from cells treated with increasing concentrations of JC-229 (0.5, 1.25, 2.5, 5, 10, 20, 30, 40, and 50 μM) for 72 h. Three biological replicates were used for each measurement (n = 3) and EC50 values were obtained from GraphPad Prism software (inhibitor vs. normalized response with variable slopes). Error bars indicate mean ± SD. Source data are provided as a Source Data file.

