Figure 1.
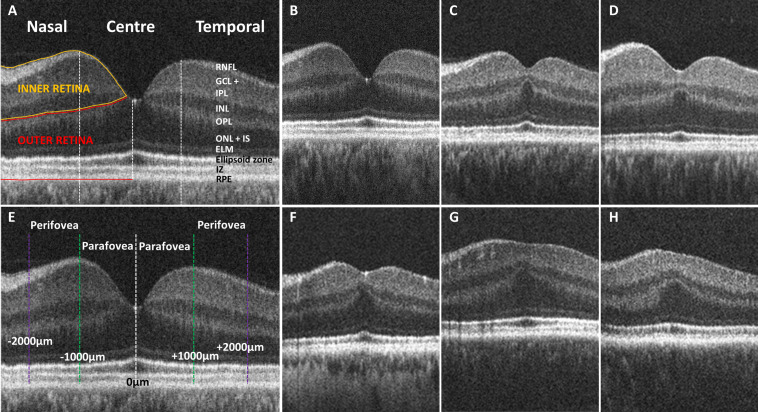
(A) Tomogram representing a horizontal B-scan through the central fovea with indicated retinal layers and central, nasal and temporal measurement locations. Inner retinal layers (RNFL, GCL-IPL complex and INL) are indicated by the yellow border. Outer retinal layers (OPL, ONL, IS, OS and RPE) are indicated by the red border. (E) Thickness measurements were obtained at the central fovea (0 µm; white dashed line) in addition to parafoveal (±1000 µm; green dashed line) and perifoveal locations (±2000 µm; purple dashed line). (B) Foveal tomogram of a control demonstrating normal foveal morphology. (C-D, F) Foveal tomograms of carriers demonstrating grade 1a foveal hypoplasia, with continuation of inner retinal layers posterior to the foveola, a nearly normal foveal pit, OS lengthening and ONL widening. (G–H) Carrier tomograms demonstrating grade 1b foveal hypoplasia with a shallow foveal indent, OS lengthening and ONL widening. ELM, external limiting membrane; GCL, ganglion cell layer; IPL, inner plexiform layer; INL, inner nuclear layer; IS, inner segment; IZ, interdigitation zone; OPL, outer plexiform layer; ONL, outer nuclear layer; RNFL, retinal nerve fibre layer; RPE, retinal pigment epithelium.

