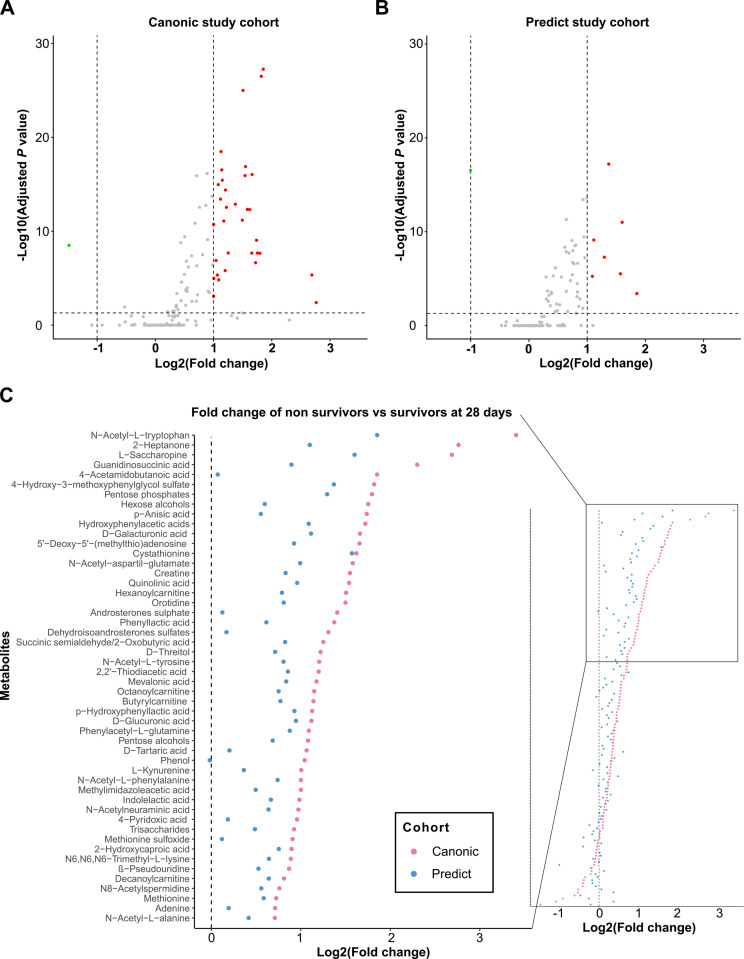
Figure 1.
Mortality at 28 days is associated with a general increase in metabolite levels. (A) Volcano plots showing the results of pairwise comparisons of blood metabolites levels of patients from CANONIC (left) and PREDICT (right) study cohorts relative to mortality at 28 days. The vertical dashed lines indicate the threshold for the twofold abundance difference. The horizontal dashed line indicates the p value=0.05 threshold. (B) Cleveland plots. Overview of the fold change of all detected metabolites between patients who died within 28 days after enrolment versus those who survived in each cohort in both CANONIC and PREDICT (red and blue dots, respectively) study cohorts, using CANONIC cohort as reference. Left inset shows the annotation of the top 50 metabolites.

