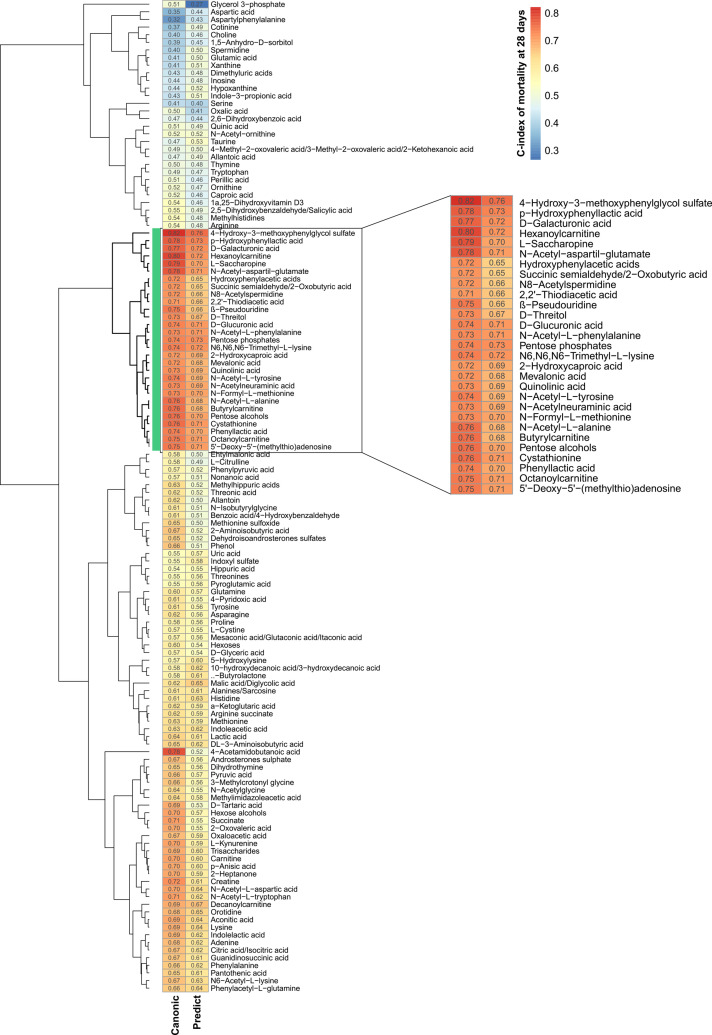
Figure 2.
Metabolite abilities to predict mortality at 28 days and their similarities between study cohorts. Hierarchical clustering analysis of C-index values obtained assessing mortality at 28 days with each measured metabolite in the CANONIC (left column) and the PREDICT (right column) study cohort. Vertical green bar and inset identify the cluster formed by the 29 metabolites with the highest C-index in both cohorts.

