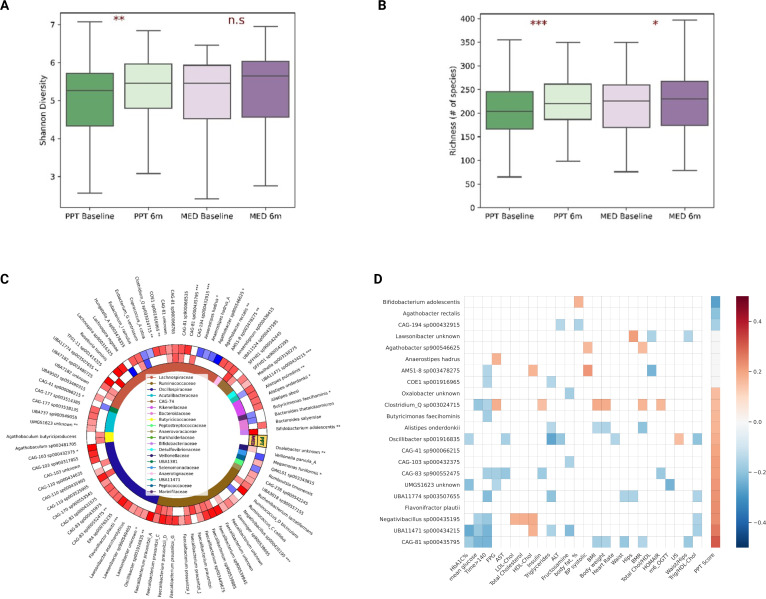
Figure 2.
PPT intervention increases microbiome diversity and richness and exerts specific microbiome species changes that are associated with clinical outcomes. (A) Boxplots showing microbiome diversity (Shannon's diversity index) by arm and time point (baseline vs 6 months). Asterisks on top denote significance level for difference within arms (one-sided t-test). n.s, non significant; *p<0.05, **p<0.01, ***p<0.001. (B) Same as in A but for microbiome richness (# of species). (C) Heatmap of species-level microbiome taxa significantly changed within arms compared to baseline (p<0.05, one-tailed t-test, FDR corrected). Red and blue cells denote enrichment and reduction, respectively. White cells denote no significant change. Asterisks next to species names denote significant differences between arms in the respective species (MW-test, *p<0.05, **p<0.01, ***p<0.001). Species are grouped based on taxonomy hierarchy, with family-level taxonomy represented by colours in the inner circle and in the legend in the centre. (D) Heatmap showing significant associations (p<0.05) between 6 months changes in microbiome species (those distinctly changed between arms) and 6 months changes in clinical readouts or PPT adherence score across the cohort. ALT, alanine transaminase; AST, aspartate aminotransferase; BMI, body mass index; BMR, basal metabolic rate; BP, blood pressure; FDR, false discovery rate; FPG, fasting plasma glucose; HbA1c, hemoglobin A1c; HDL-C, high-density lipoprotein cholesterol; LDL-C, low-density lipoprotein cholesterol; OGTT, oral glucose tolerance test; PPT, personalised postprandial-targeting.

