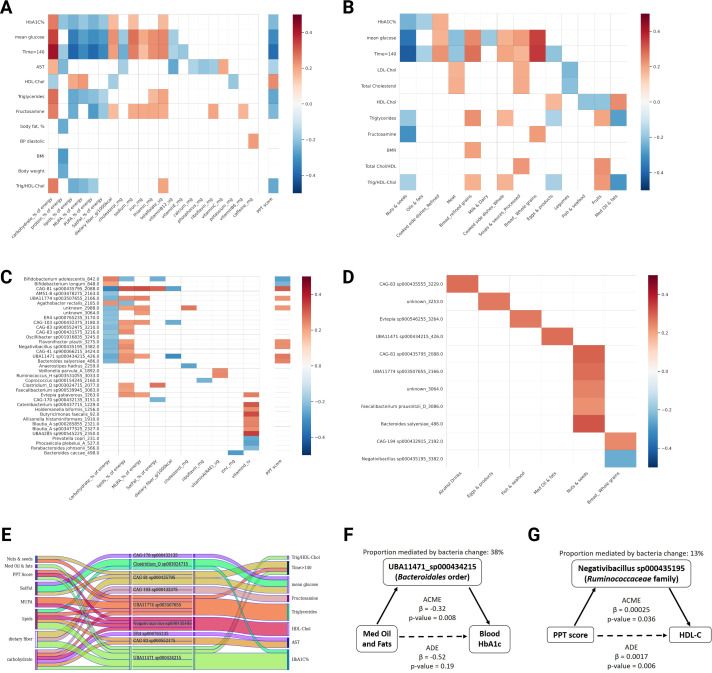
Figure 3.
Changes in specific gut microbiome species partially mediate the effect of dietary changes on clinical outcomes. (A) Heatmap showing significant associations (p<0.05, FDR corrected) between 6 months changes in clinical readouts and 6 months changes in nutrient consumption or PPT adherence score across the cohort. (B) Heatmap showing significant associations (p<0.05, FDR corrected) between 6 months changes in clinical readouts and 6 months changes in food categories consumption across the cohort. (C) As in A but for microbiome species versus nutrients or PPT adherence score. (D) As in B but for microbiome species versus food categories. (E) Alluvial plot showing significant mediatory effects of microbiome species (middle) in the association between dietary changes (left) and clinical outcomes (right). (F, G) Two examples of mediation paths with assessment of the proportional mediatory effect of microbiome species. ACME, average causal mediation effect; ADE, average direct effect; AST, aspartate aminotransferase; BMI, body mass index; BMR, basal metabolic rate; BP, blood pressure; FDR, false discovery rate; FPG, fasting plasma glucose; HbA1c, hemoglobin A1c; HDL-C, high-density lipoprotein cholesterol; LDL-C, low-density lipoprotein cholesterol; MUFA, monounsaturated fatty acids; PPT, personalised postprandial-targeting.

