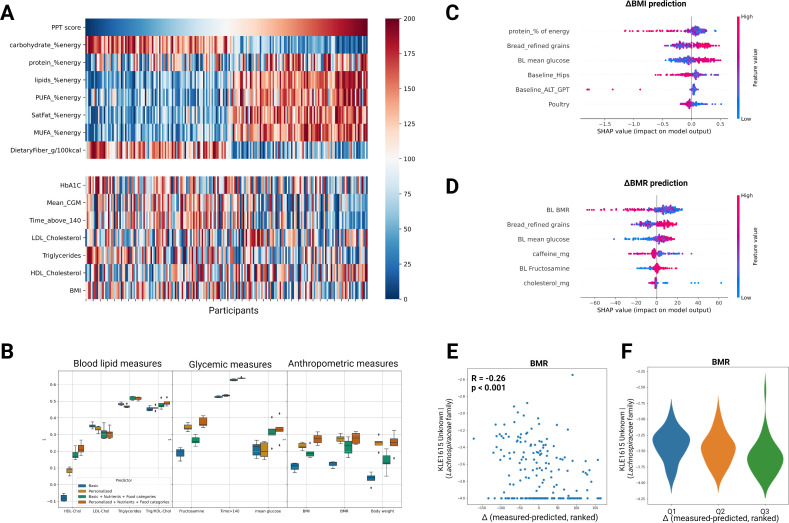
Figure 4.
Machine learning models trained on dietary changes and baseline clinical data predict clinical outcomes. (A) Heatmap showing the interindividual variation in clinical response to similar dietary modifications across the cohort. Participants (columns) are ordered by the 6 months change in PPT adherence score (top row). Ranked changes in major dietary features and clinical outcomes (rows) are presented in the upper and lower panels, respectively. (B) Box-plots showing the prediction accuracy (R) of different clinical outcomes for models trained with different sets of input features using GBDT (LightGBM, see Methods). Error bars in each box plot are based on repeated full cross validation. (C) Top six features contributing to BMI prediction (‘Personalised+Diet’ model), using the SHAP analysis. (D) As in C but for the ΔBMR prediction model. (E) Scatter plot of the correlation between baseline levels of one bacterial species from the Lachnospiraceae family (‘KLE1615_Unknown’) and the difference (Δ) between measured and predicted change in BMR outcome. (F) As in E but presented as violin plots for three quantiles of difference (Δ) from prediction (participants with zero levels of this bacterial species at baseline were filtered out). ALT, alanine transaminase; BMI, body mass index; BMR, basal metabolic rate; BP, blood pressure; CGM, continuous glucose monitoring; FDR, false discovery rate; FPG, fasting plasma glucose; GBDT, gradient-boosted decision trees; HbA1c, hemoglobin A1c; HDL-C, high-density lipoprotein cholesterol; LDL-C, low-density lipoprotein cholesterol; MUFA, monounsaturated fatty acids; PPT, personalised postprandial-targeting; PUFA, polyunsaturated fatty acid.

