Figure 5.
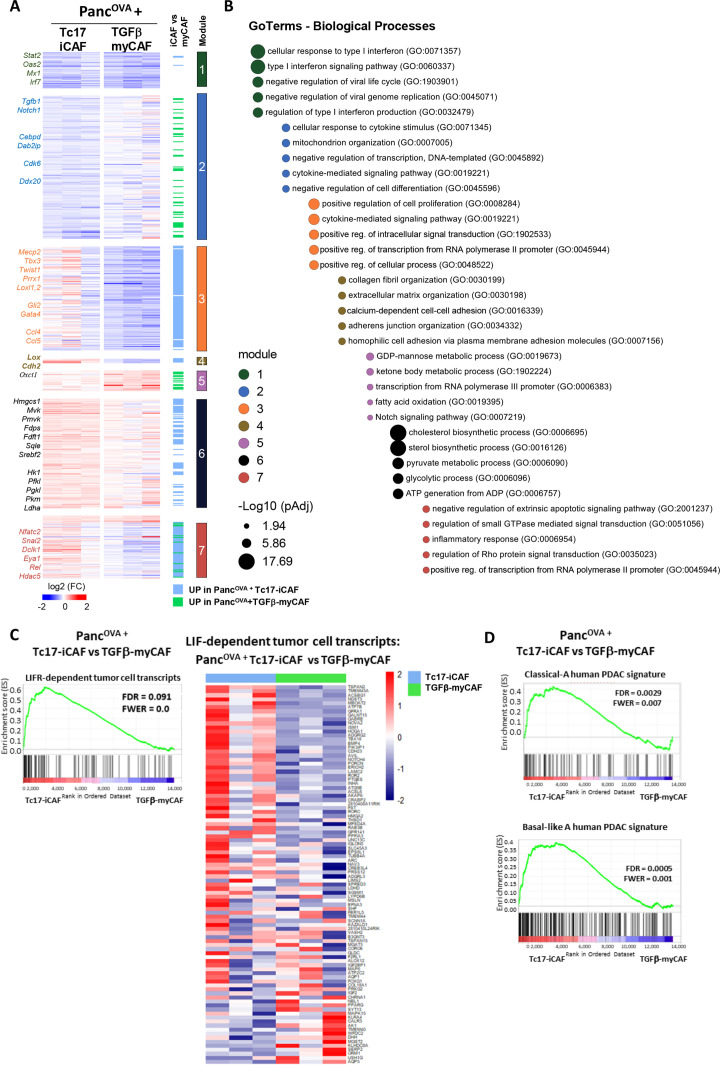
Tc17-iCAF affect pancreatic tumour cell transcriptional profile. (A) Heatmap of differentially expressed genes (Z score normalised, FDR ≤0.1) by PancOVA cells after 36 hours of co-culture with Tc17-iCAF or TGFβ-myCAF classified into modules based on the mutual upregulation or downregulation (n=3, biological replicates). (B) Pathway enrichment analysis for gene ontologies (GO): Biological processes. Bubble graph displays the five most significantly enriched pathways by –log10 value (p adj) for seven modules established in (A). (C) GSEA for differential expression of LIF-dependent pancreatic cancer cell transcripts obtained from LifrWT KPf/fCL vs Lifrf/fKPf/fCL mice42 in PancOVA tumour cells after co-culture with Tc17-iCAF vs TGFβ-myCAF. (C, right), heatmap of color-coded z-scores from the rlog transformed expression values based on the GSEA. (D) GSEA for differential expression of classical-A or Basal-like A human PDAC transcripts33 in PancOVA tumour cells after co-culture with Tc17-iCAF vs TGFβ-myCAFs. CAF, cancer-associated fibroblasts; GSEA, pancreatic ductal adenocarcinoma; PDAC, pancreatic ductal adenocarcinoma.

