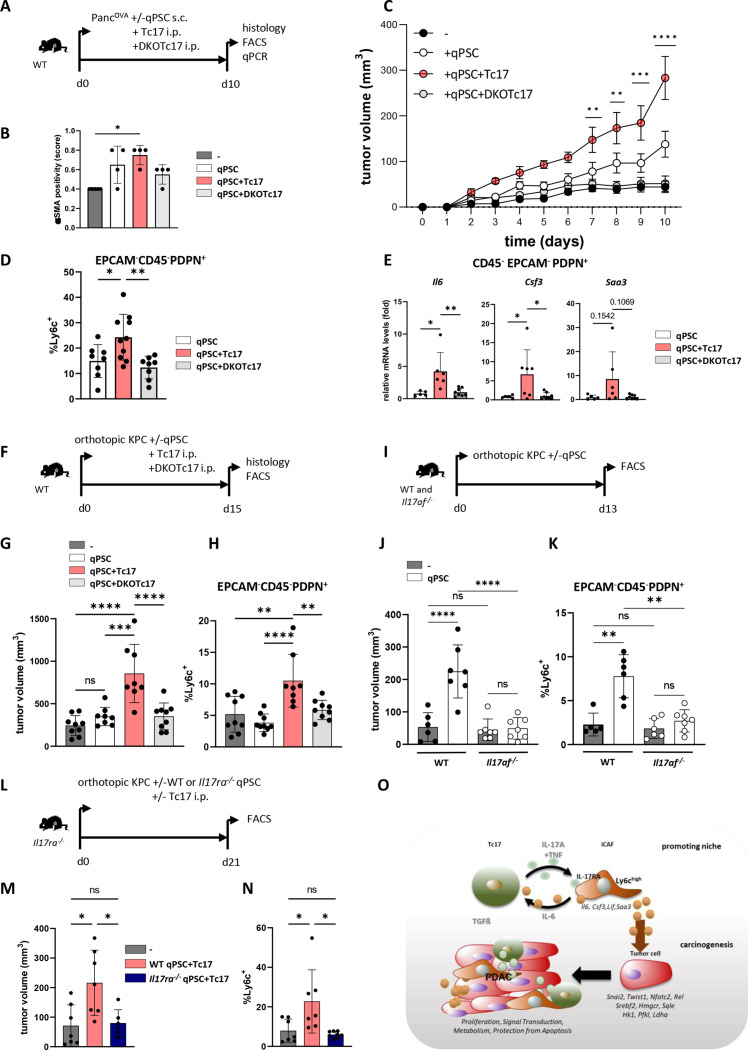
Figure 6.
Tc17 cells promote tumour growth in vivo via IL-17RA+iCAF. (A) Scheme of the experimental design. 5 ×10⁵ PancOVA tumour cells±5 × 10⁵ CD90.1+qPSC were subcutaneously co-injected into WT mice, which on the same day received i.p. injections of PBS or of 106 WT (Tc17) or IL-17A/FDKO Tc17 (DKOTc17) cells differentiated from WT or IL-17A/FDKO CD8+ T cells in the presence of TGFβ+IL-6. Histology and CAF analysis were performed at the indicated end of the experiment. (B) Quantification of αSMA staining in tumour tissue of mice injected with PancOVA cells alone (-) or co-injected with qPSC (qPSC), with qPSC+Tc17 cells (qPSC+Tc17) or with qPSC+DKOTc17 cells (qPSC+DKOTc17), based on previously published scoring,17 (n=4). (C) Tumour-growth curve of subcutaneous tumours is shown (tumour volume mm,3 mean±SEM, n=5 mice, one representative of two independent experiments each with 5–7 mice). **p<0.01, ***p<0.001, ****p<0.0001 indicate the tumour volume comparisons between the groups with qPSC+Tc17 versus qPSC. (D) FACS analysis of Ly6chigh cell frequency in gated EPCAM-CD45-PDPN+ fibroblasts in subcutaneous tumours (n=8–10). (E) qPCR analysis of the indicated gene expression by sorted from subcutaneous tumours EPCAM-CD45-PDPN+ fibroblasts (mean±SD, n=5–8). Fold of mRNA expression is shown, normalised to the qPSC group, which was arbitrarily set to 1. (F) Scheme of the experimental design. 2×10⁴ KPC tumour cells with/without 2×10⁴ CD90.1+qPSC were orthotopically injected into WT mice, which received on the next day i.p. injections of PBS or 106 WT (Tc17) or IL-17A/FDKO Tc17 (DKOTc17) cells or PBS. The tumour volume and CAF were analysed at the indicated end of the experiment. (G) Tumour volume of orthotopic tumours of mice injected with KPC cells alone (-) or co-injected with qPSC (qPSC), with qPSC+Tc17 cells (qPSC+Tc17) or with qPSC+DKOTc17 cells (qPSC+DKOTc17) is shown (tumour volume in MM3; mean±SD, n=8–9 mice). (H) FACS analysis of Ly6chigh cell frequency in gated EPCAM-CD45-PDPN+ cells in orthotopic tumours of mice treated as indicated (mean±SD, n=8–9). (I) Scheme of the experimental design. 1.5×10⁴ KPC tumour cells±6 × 10⁴ CD90.1+qPSC were orthotopically injected into WT or Il17af-/- mice. The tumour volume and CAF were analysed at the indicated end of the experiment. (J) Tumour volume of orthotopic tumours of WT and Il17af-/- mice injected with KPC cells alone (-) or co-injected with qPSC (qPSC) is shown (tumour volume in MM3; mean±SD, n=6–7 mice). (K) FACS analysis of Ly6chigh cell frequency in gated EPCAM-CD45-PDPN+ fibroblasts in orthotopic tumours (n=6–7). (L) Scheme of the experimental design. 2×10⁴ KPC tumour cells±2 × 10⁴ WT or Il17ra-/- CD90.1+qPSC were orthotopically injected into Il17ra-/- mice, which received on the next day i.p. injection of PBS or 106 Tc17 cells. The CAF analysis was performed at the indicated end of the experiment. (M) Tumour volume of orthotopic tumours of Il17ra-/- mice injected with KPC cells alone (-) or co-injected with WT qPSC+Tc17 cells (WT qPSC+Tc17) or with Il17ra-/- qPSC+Tc17 cells (Il17ra-/- qPSC+Tc17) is shown (tumour volume in MM3; mean±SD, n=8–10 mice). (N) FACS analysis of Ly6chigh cell frequency in gated EPCAM-CD45-PDPN+ cells in tumours of mice treated as indicated (mean±SD, n=6–7). (O) Summary with the proposed mechanism of an indirect cancer-promoting role of Tc17 cells in PDAC. Tc17 cells via synergistic effect of secreted cytokines, IL-17A and TNF, shift PSC differentiation towards iCAF formation in an IL-17RA-dependent manner. In turn, Tc17-induced iCAF promote Tc17 differentiation via secreted IL-6 in combination with TGFβ. Furthermore, Tc17-induced iCAF imprint pancreatic tumour cells with a unique transcriptional profile characterised by the expression of genes involved in proliferation, signal transduction, metabolism and protection from apoptosis, thereby enhancing tumour growth. (B, D, E, G, H, J, K, M, N) Biological replicates are plotted. In (C) *p<0.05, **p<0.01, ***p<0.001, ****p<0.0001 determined by two-way ANOVA with Bonferroni post hoc test, in (B, D, N) *p<0.05, **p<0.01 by Kruskal-Wallis-test, in (E, G, H, J, K, M) *p<0.05, **p<0.01, ***p<0.001, ****p<0.0001 and p values by one-way ANOVA followed by Tukey’s HSD multiple comparison test. ANOVA, analysis of variance; iCAF, inflammatory cancer-associated fibroblasts; PBS, phosphate-buffered saline; PDAC, pancreatic ductal adenocarcinoma.

