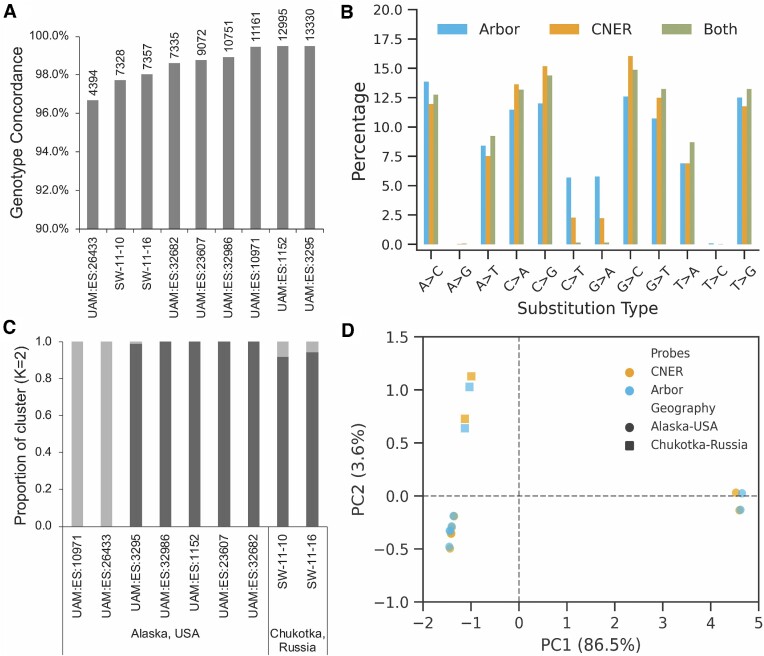
Figure 4.
Genotyping and estimated evolutionary relationships between the ancient horse samples. (A) Genotype concordance between SNP capture data generated using CNERs and Arbor myBaits. Numbers above the bars indicate the sites genotyped by both methods in a given horse sample. (B) Percentage of substitution types shared between (green) and unique to CNERs (yellow) and Arbor myBaits (cyan). (C) Admixture analysis with K = 2 separated the ancient horses into two lineages regardless of their geographic location. (D) Principal component analysis of genotype likelihood covariance matrix of 23771 nuclear SNP sites in nine ancient horses. Transitions are filtered out for population analyses due to cytosine deamination in aDNA. PC1 segregated horses into two major clades and PC2 separated horses into the Western (Chukotka) and Eastern (Alaska) Beringian populations.

