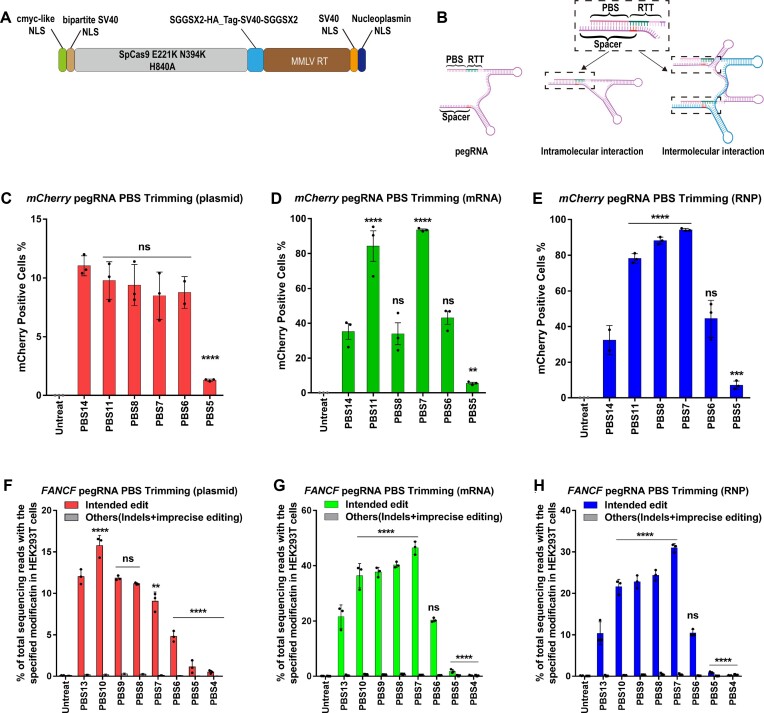
Figure 1.
PE2 editing efficiency as a function of pegRNA PBS length at three genomic sites in HEK293T cells using three different delivery platforms. (A) Architecture of the PEmax protein expression construct. (B) The PBS and spacer sequence within the pegRNA are complementary to each other and can potentially form intramolecular and intermolecular interactions through Watson–Crick base pairing. The complementarity can extend into the first 3 nt of the RTT region if it is identical to the DNA target site (this region is highlighted in the spacer sequence in red). (C–E) Conversion of a stop codon (TAG) to glutamine (CAG) by prime editing to restore function to a mCherry reporter in HEK293T cells (4). Frequencies of mCherry positive cells were quantified by flow cytometry 72 h following treatment. (C) 200 ng PEmax plasmid and 100 ng pegRNA plasmid were used for transient transfection; (D) 1 μg PEmax mRNA and 100 pmol pegRNA were used for mRNA nucleofection; and (E) 50 pmol PEmax protein and 200 pmol pegRNA were used for RNP nucleofection. One-way ANOVA was used to compare all the groups for each graph, PBS14 was used as a control column for multiple comparisons. ns indicates P > 0.05, ** indicates P ≤ 0.01, *** indicates P ≤ 0.001 and **** indicates P ≤ 0.0001 (also see Supplementary table). (F–G) PE-specified intended substitution (G•C to T•A transversion) at the +5 position of FA Complementation Group F (FANCF) site or other editing outcomes (indels and imprecise prime editing is combined). (F) 200 ng PEmax plasmid and 100 ng pegRNA plasmid were used for transient transfection; (G) 1 μg PEmax mRNA and 100 pmol pegRNA were used for mRNA nucleofection; and (H) 50 pmol PEmax protein and 200 pmol pegRNA (from IDT) were used for RNP electroporation. Cells were harvested 72 h following treatment. One-way ANOVA was used to compare the intended edit across all the groups for each graph, PBS13 was used as a control column for multiple comparisons. ns indicates P > 0.05, ** indicates P ≤ 0.01, and **** indicates P ≤ 0.0001 (also see Supplementary table).

