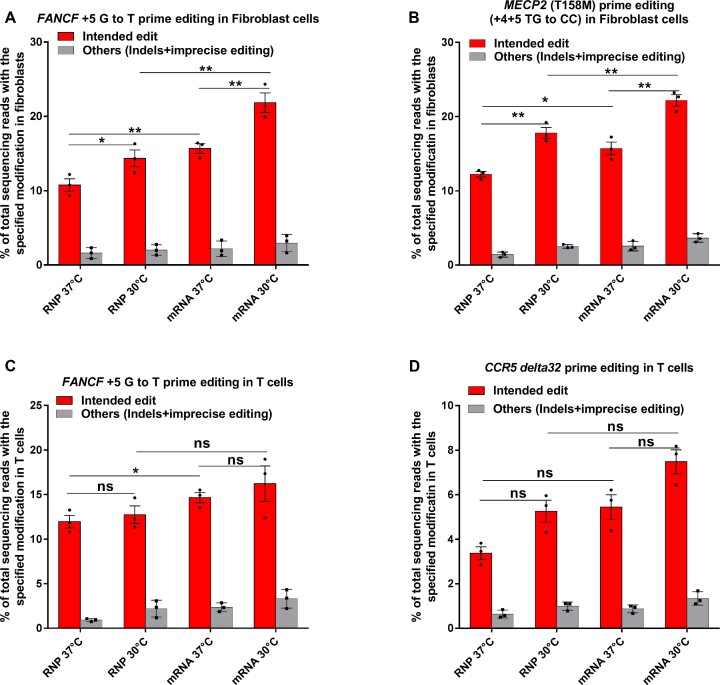
Figure 4.
Prime editing efficiency in primary Fibroblasts and Primary T cells. (A, B) RNP and mRNA-mediated PE3 editing efficiencies at the specified positions for (A) FANCF (+5 G to T) and (B) MECP2 (+4+5 TG to CC) in fibroblast cells at 30°C and 37°C. Editing efficiencies reflect the frequency of sequencing reads that contain the intended precise edit or others (indels and imprecise prime editing) among all sequencing reads. Bars and error bars represent mean ± s.d. (n = 3 biologically independent replicates). (C, D) RNP and mRNA-mediated PE3 editing efficiencies at the specified positions for FANCF (+5 G to T) and CCR5 (+4+5 TG to CC) in Primary T cells at 30°C and 37°C. Editing efficiency reflects the frequencies of sequencing reads that contain the intended precise edit and others (indels and imprecise prime editing) among all sequencing reads. Bars and error bars represent mean ± s.d. (n = 3 biologically independent replicates). One-way ANOVA statistical analysis was used to determine the significance of precise prime editing at different temperatures, ns indicates P > 0.05, * indicates P ≤ 0.05, and ** indicates P ≤ 0.01 (also see Supplementary table).

